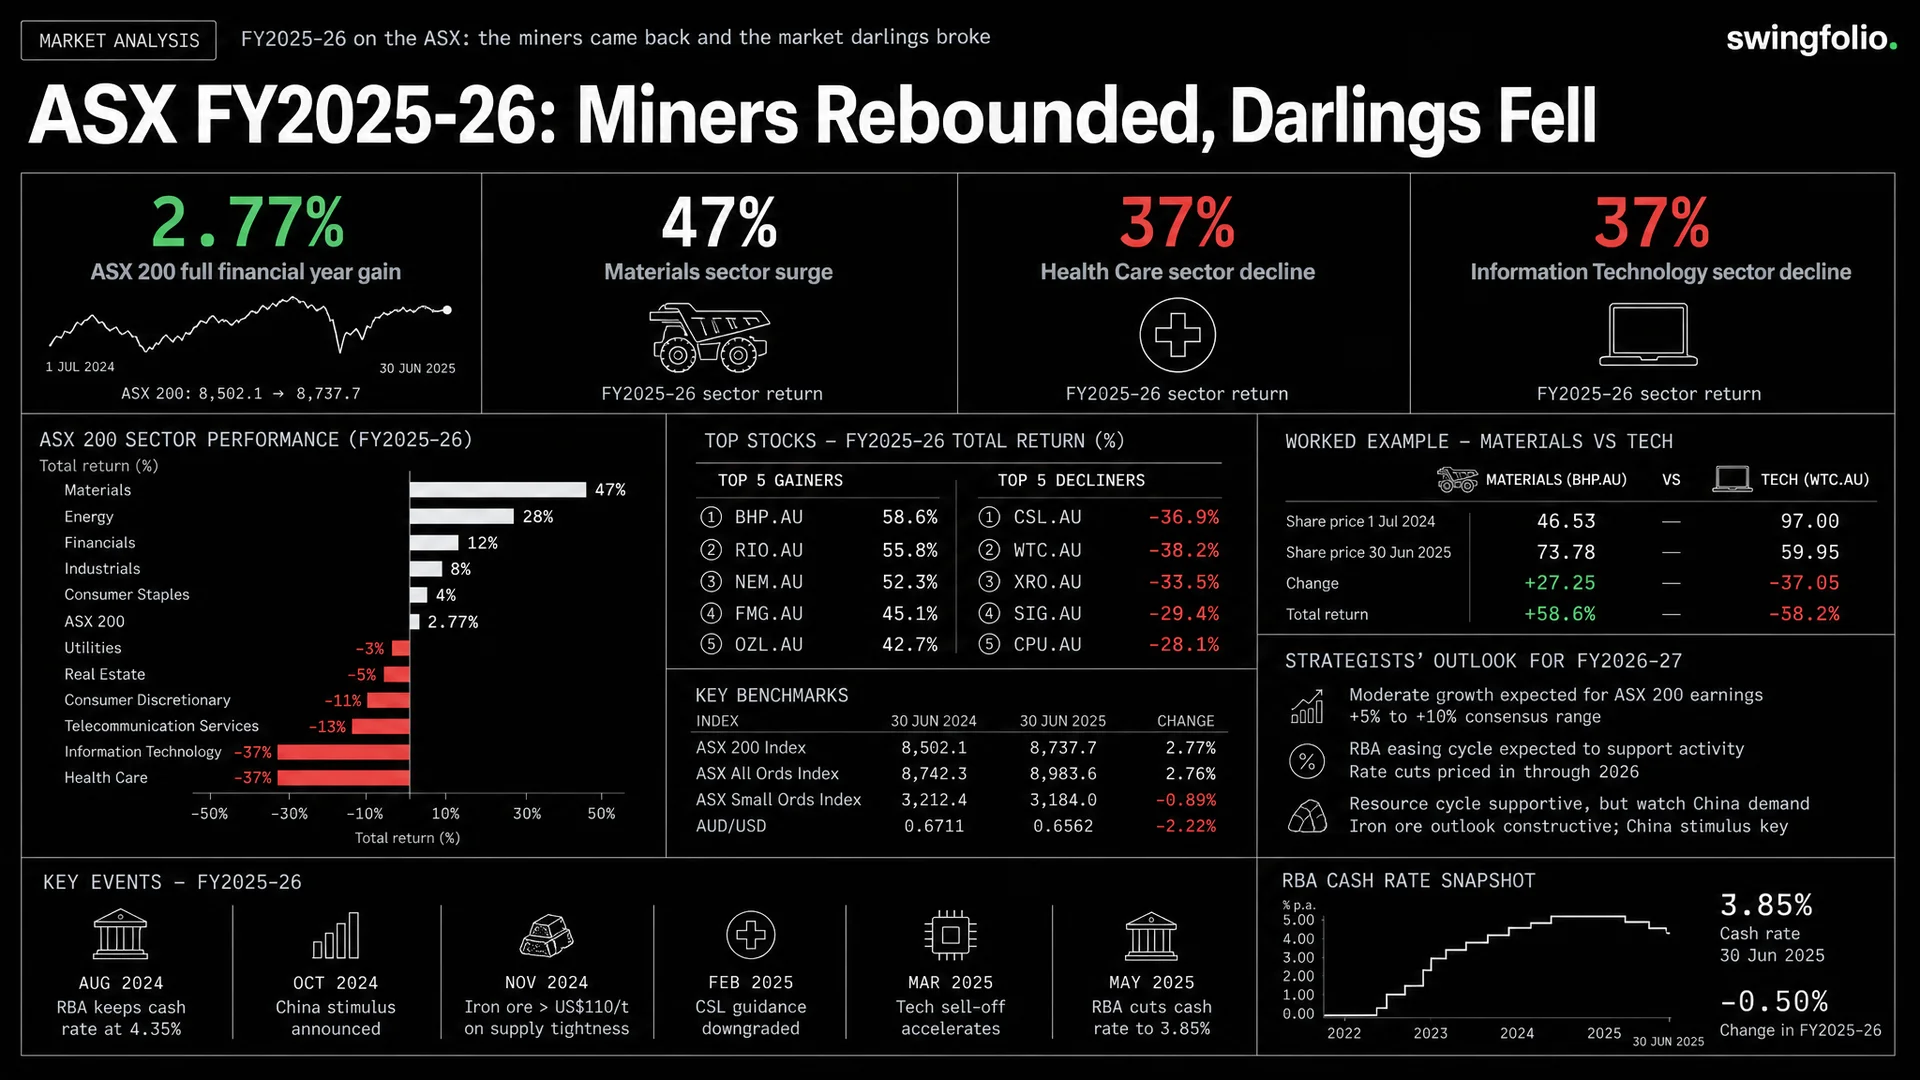
S&P/ASX 200 close on 30 June 2026: 8,778.7, up 2.77% over the financial year on a price-return basis.
That modest index move hid a sharp rotation. Materials rose 47.5%, while Health Care fell 37.4% and Information Technology fell 37.2%. BHP and Rio Tinto gained more than 60%. WiseTech, Xero, Cochlear and CSL each lost more than half their starting value.
The tables compare the completed financial year; a September checkpoint follows below. The company returns compare each ASX listing's unadjusted AUD close on 30 June 2025 with its close on 30 June 2026. They exclude dividends, franking credits, fees and tax. Corporate actions require separate interpretation. Rounded table figures may differ from the more precise figures in the text. They describe selected companies, not an average ASX share.
The year had two distinct halves
The ASX month-end series shows the index at 9,198.6 on 28 February 2026 and 8,778.7 on 30 June. The pullback came as oil, inflation and interest-rate expectations changed.
Rates supplied the clearest before-and-after marker. The Reserve Bank cut the cash rate to 3.60% in August 2025. It then raised the rate by 0.25 percentage points in February, March and May 2026, ending the financial year at 4.35%. The RBA cash-rate history records each effective date and decision.
The index figure is a price return, so it does not include distributions. ASX's historical market statistics show the index rising from 8,542.3 at 30 June 2025 to 8,778.7 at 30 June 2026. S&P Dow Jones Indices publishes separate price-return, total-return and franking-credit versions of the S&P/ASX 200. Keep that distinction in mind when comparing the 2.77% headline with a portfolio that received dividends.
The FY2025-26 sector scorecard
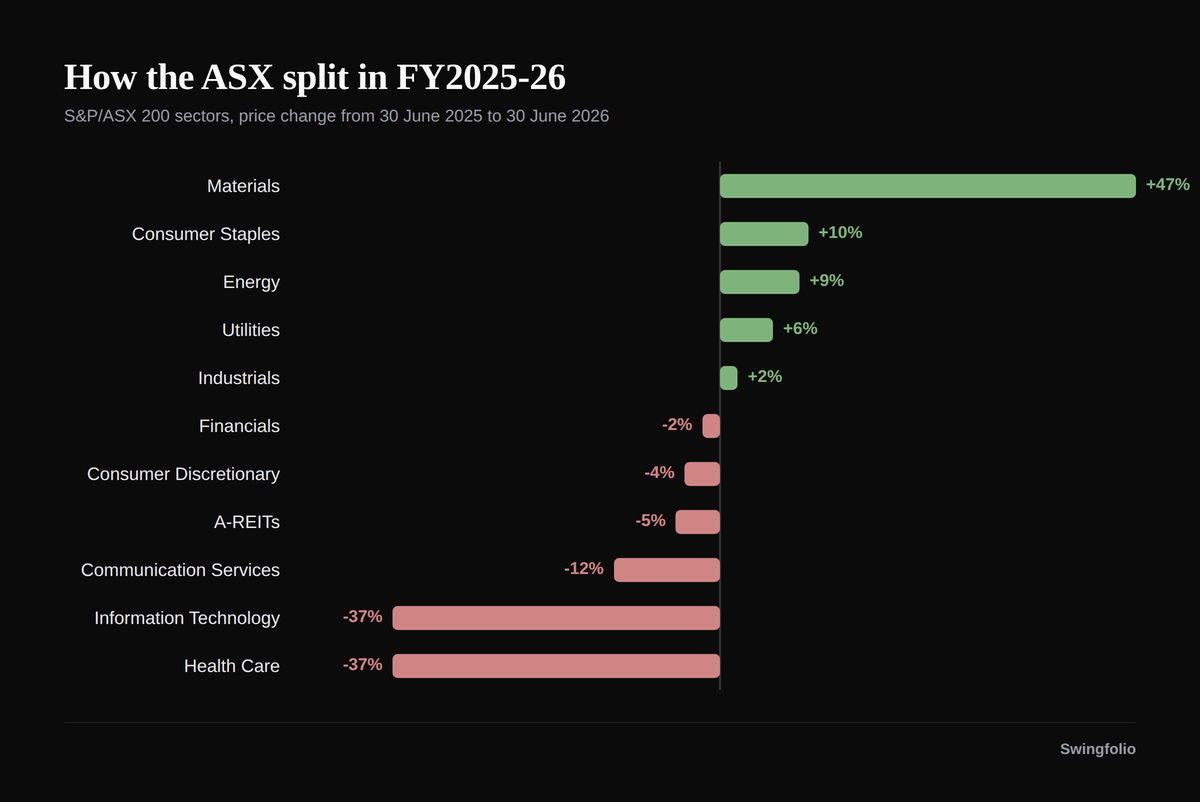
The three quoted sector returns use EODHD daily index closes on 30 June 2025 and 30 June 2026. Each return is (ending close / starting close - 1) x 100, rounded to one decimal place in the prose. The chart labels round the same results to whole percentages. The endpoints were 15,858.2002 to 23,387.6992 for AXMJ.INDX, 41,603.1992 to 26,043.6992 for AXHJ.INDX, and 2,900.8 to 1,821.2 for AXIJ.INDX. EODHD describes the daily endpoint fields in its historical-data documentation.
The chart's more than 80 percentage-point spread between Materials and the weakest sectors explains why the broad index alone gives an incomplete picture of the year. The company tables below use separate share-price calculations.
The winners: miners and a lithium reversal
Materials led the market, up 47.5%. Gold and copper prices rose, while iron ore stayed much closer to its starting range. That combination rewarded miners with greater copper and gold exposure.
BHP (BHP.AU) rose 61.6%, from $36.75 to $59.40. Rio Tinto (RIO.AU) gained 61.0%. Evolution Mining (EVN.AU) rose 50.8% and Newmont (NEM.AU) gained 54.1%.
Lithium shares produced the more extreme moves after two weak years. Pilbara Minerals (PLS.AU) rose about 276%, Mineral Resources (MIN.AU) about 188%, and Core Lithium (CXO.AU) about 155%. Those moves are individual price returns from depressed starting points. They do not establish a sector average or forecast another year of gains.
| Selected large-cap winners | 30 Jun 2025 close | 30 Jun 2026 close | Price return |
|---|---|---|---|
| BHP (BHP.AU) | $36.75 | $59.40 | +61.6% |
| Rio Tinto (RIO.AU) | $107.13 | $172.51 | +61.0% |
| Newmont (NEM.AU) | $87.31 | $134.52 | +54.1% |
| Evolution Mining (EVN.AU) | $7.79 | $11.75 | +50.8% |
| South32 (S32.AU) | $2.91 | $3.90 | +34.0% |
| Woolworths (WOW.AU) | $31.11 | $40.03 | +28.7% |
These are selected large companies, not a ranked list of every ASX company. The endpoint rows come from Swingfolio's stored daily price history.
The losers: expensive favourites repriced
Several highly valued growth and health-care companies moved the other way as earnings news, governance issues and higher discount rates changed what investors would pay.
WiseTech Global (WTC.AU) fell 69.7%, from $109.03 to $33.00. Xero (XRO.AU) fell 59.8%. CSL (CSL.AU) dropped 52.1%, from $239.48 to $114.74, while Cochlear (COH.AU) fell 59.5%. Seek (SEK.AU) lost 44.1% and Treasury Wine Estates (TWE.AU) fell 39.1%.
The common lesson is narrower than “rates caused everything.” Rates changed valuation pressure, but company-specific guidance, acquisitions and governance news also mattered. A year review can show the timing and size of the repricing without pretending to isolate one cause for every daily move.
| Selected large-cap losers | 30 Jun 2025 close | 30 Jun 2026 close | Price return |
|---|---|---|---|
| Temple & Webster (TPW.AU) | $21.32 | $6.20 | -70.9% |
| WiseTech (WTC.AU) | $109.03 | $33.00 | -69.7% |
| Xero (XRO.AU) | $179.80 | $72.22 | -59.8% |
| Cochlear (COH.AU) | $300.42 | $121.75 | -59.5% |
| CSL (CSL.AU) | $239.48 | $114.74 | -52.1% |
| Seek (SEK.AU) | $24.05 | $13.45 | -44.1% |
The WiseTech, Xero, Cochlear, CSL and Seek endpoints come from Swingfolio's stored daily price history. Temple & Webster's 30 June 2026 closing price comes from EODHD daily history; see its historical-data documentation.
The banks split, then tax policy changed the next-year debate
ANZ (ANZ.AU) rose 21.2%, while Commonwealth Bank (CBA.AU) fell 10.9%. CBA began the year on a much higher earnings multiple than the other major banks, so its decline also changed the sector's valuation spread.
The 2026-27 Federal Budget announced capital-gains and negative-gearing reforms on 12 May 2026. It did not abolish the 50% CGT discount for every asset on Budget night. The enacted Treasury Laws Amendment (Tax Reform No. 1) Act 2026 applies most investor changes from 1 July 2027 and contains transition rules and exceptions.
That distinction matters for this retrospective: the reform changed expectations during FY2025-26, but it did not change the calculation basis of the share-price returns in these tables. Read the dated Budget and CGT guide before applying the later rules to an investment.
What happened by September 2026
This remains a fixed 30 June review, so the tables do not mix later performance into the financial-year rankings. The September reading below shows where the broad index stood after the period ended.
On 11 September 2026, the S&P/ASX 200 price index stood at 8,741.21, according to the index provider's September reading. That was 0.43% lower for the September quarter to that date. The RBA had also left the cash rate at 4.35% in August after the three increases earlier in 2026.
That later reading did not confirm a broad continuation or reversal of the FY2025-26 rotation. It is included as an endpoint update, not as a fresh stock-by-stock performance table.
The dated FY2026-27 outlook
The year ended with three live debates: whether resources could keep leading, whether 4.35% marked the peak cash rate, and whether the fallen growth and health-care names had reset far enough. Forecasts put numbers around those questions, but they are scenarios rather than outcomes.
| Forecast published | Dated view | What would challenge it? |
|---|---|---|
| Morgan Stanley, May 2026 | A 12-month S&P/ASX 200 target of 9,250, with mining and energy earnings carrying more of the advance | Weaker commodity earnings or another contraction in the index valuation |
| Commonwealth Bank, June 2026 | The RBA holding at 4.35% into 2027, with a possible cut in May | Persistent inflation that requires another increase |
| J.P. Morgan Global Research, June 2026 | December 2026 forecasts of US$6,000 an ounce for gold and US$14,800 a tonne for copper | Higher rates, weaker demand or easing supply constraints |
The Morgan Stanley target reported on 19 May 2026 remained above the 30 June close. The CBA rate view and J.P. Morgan commodity outlook were also published before the financial year closed. By September, the broad index remained below 9,250 and the cash rate remained 4.35%, but none had reached its stated horizon.
This is why the new-year outlook still has tension. A resource-led index can rise while many holdings fall, and a cheaper former favourite can keep falling if its earnings case weakens.
Questions for the new financial year
The next-year decision is not whether last year's winners were “right.” It is whether the conditions behind each holding still match the price and risk you are taking.
- How much of your return came from one sector?
- Did dividends change the result relative to these price-only comparisons?
- Are several positions exposed to the same commodity or rate move?
- Has a fallen stock become cheaper because expectations reset, or because earnings weakened?
- What evidence would make you reduce a winner rather than extrapolate its last year?
The FY2025-26 index gain looked quiet, but the holdings underneath it were not. Miners rose sharply while several former growth and health-care favourites lost half their value. That is why a portfolio review needs sector, stock and position-level results alongside the headline index.
Start the 30-day trial to compare your own FY2025-26 trades, sector exposure and realised results in Swingfolio.
General information only. Not financial advice. Past performance is not a guide to future returns.