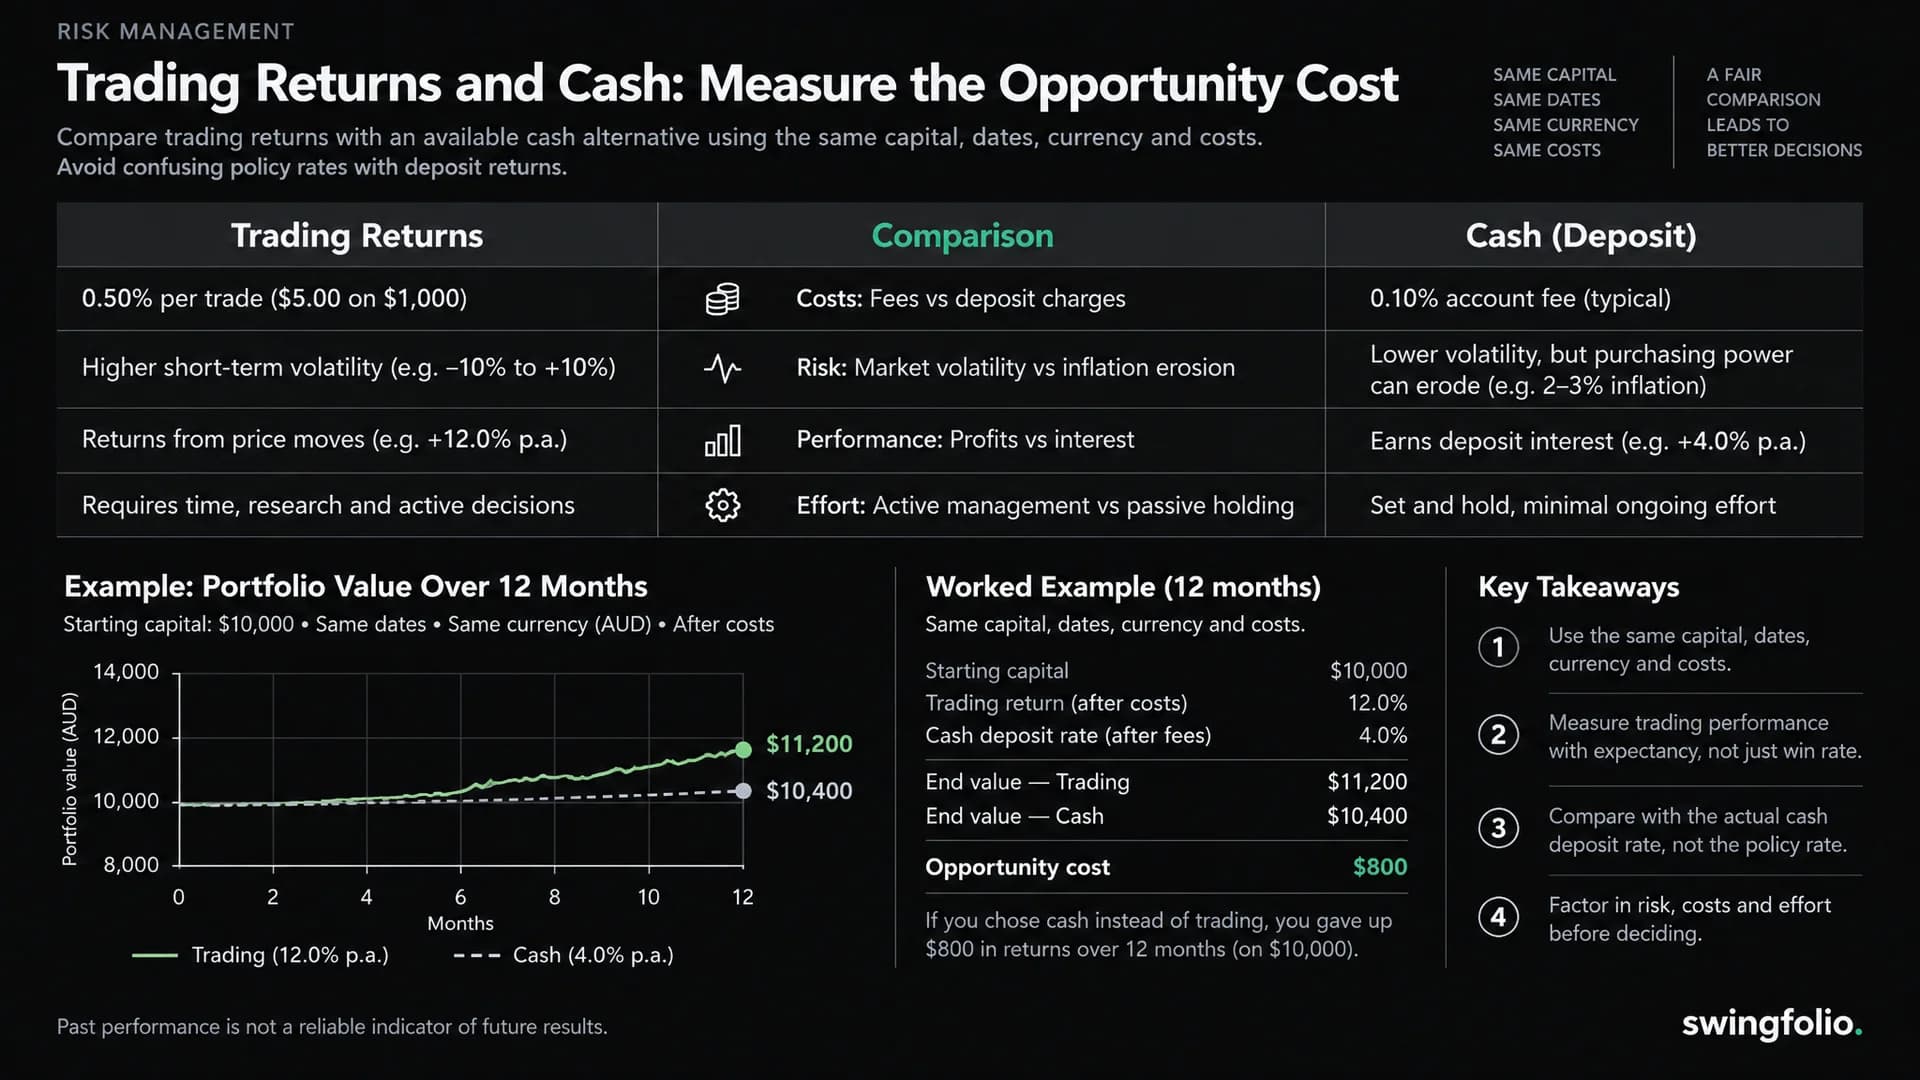
Compare a trading strategy with a cash alternative you could actually have held over the same period. Use the same starting capital, currency and cash-flow assumptions, and include the relevant costs.
The difference is an opportunity-cost comparison. It helps you judge whether the extra return justified the risk and work, but it does not make every individual trade responsible for beating an annual cash rate.
Choose the cash benchmark carefully
A central-bank policy rate is not the rate paid on every savings account. The RBA defines the cash rate by reference to unsecured overnight loans between banks.
For your comparison, identify an available deposit or other cash-like alternative and its actual terms. Consider bonus conditions, balance limits, fees, lockups and whether the rate changed during the period.
A deposit, a short-term government security and a cash fund also have different access and risk characteristics. Name the benchmark rather than calling them all “risk-free cash.”
A simple one-year example
Assume:
- $50,000 starting capital.
- No deposits or withdrawals during the year.
- Trading total return of 4% after trading costs, before tax.
- An available cash alternative earning 3% over the same year, before tax.
| Alternative | End-of-year gain |
|---|---|
| Trading: $50,000 × 4% | $2,000 |
| Cash: $50,000 × 3% | $1,500 |
| Trading gain above cash | $500 |
These rates are hypothetical, not current offers. Trading outperformed by one percentage point before tax.
If the account completed sixty trades, $500 ÷ 60 is about $8.33 per trade as a descriptive allocation. It is not a trade-level cash hurdle: positions use different amounts of capital for different lengths of time.
Count cash interest inside the trading account once
If your trading return already includes interest on uninvested cash, keep it there. Compare the whole account with the all-cash alternative.
Do not add that interest a second time or subtract the cash benchmark separately from each overlapping position. Choose either a portfolio comparison or a carefully defined position-level analysis.
Adjust for deposits and withdrawals
The simple $50,000 example stops working when capital changes during the year. A late deposit should not be treated as though it earned a full year's interest.
Construct a cash alternative with matching dated external flows, or use an appropriate return method and explain it. For varying rates, calculate interest over the actual rate periods rather than using today's advertised rate for the entire past year.
The benchmark comparison guide explains why consistent dates and cash flows matter.
Compare risk as well as return
A strategy that earned an extra $500 may have experienced a substantial drawdown, required margin or tied up cash when you needed it. Another may have used little time and accepted limited exposure.
Record maximum drawdown, liquidity constraints and the effort involved. You need not assign an invented hourly wage to make time visible; an honest record of hours is enough.
A one-year comparison also does not establish a durable edge. Check more than one market environment where data is available.
Keep tax assumptions separate
An after-cost, before-tax comparison is a useful first step. If comparing after tax, use the same owner's circumstances and the correct treatment for interest, gains and losses.
Do not multiply every return by one tax rate without checking the applicable rules. Tax timing can differ between cash income and unrealised investment gains.
Using Swingfolio's records
Use portfolio-level returns and cash flows where available for the chosen period. Closed-trade profit alone can omit open gains or losses, income and costs.
Record the cash benchmark separately if it is not built into the view. Retain its source, dates and assumptions with the review.
Our portfolio-return guide explains why portfolio outcomes and trade-level skill are related but different questions.
Does every trade need to beat 3%?
No. Three per cent is an annual illustrative return here. An individual trade has its own duration, capital use and risk.
Can I use the RBA cash rate as my deposit return?
Not automatically. Use an attainable product return and its conditions, or clearly label a policy-rate series as a proxy with limitations.
General information only. Example rates are hypothetical and not recommendations.