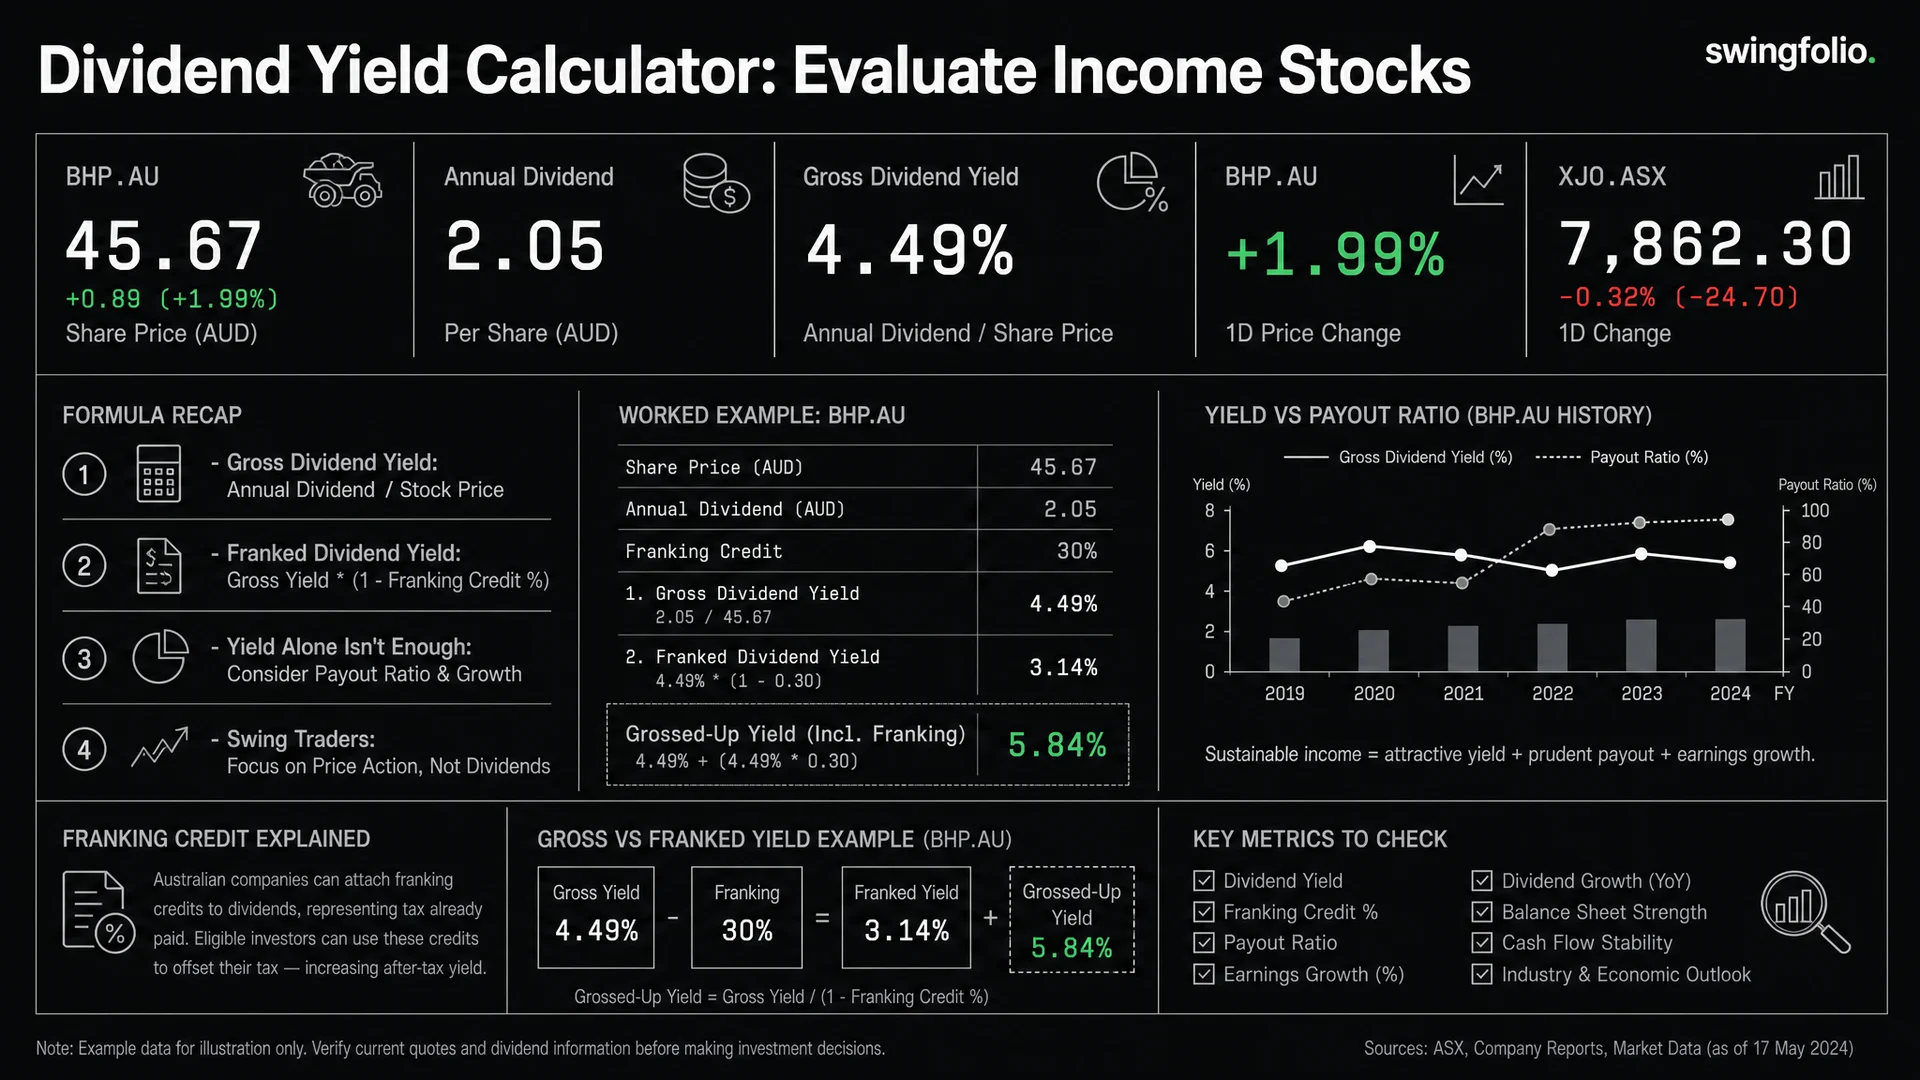
For Australian shares, dividend yield starts with cash income and often needs a second look at franking credits. Cash yield compares annual dividends per share with the share price; grossed-up yield includes the attached credit when relevant.
Neither figure tells you whether the dividend will continue or whether a falling share price has overwhelmed the income. This guide works through cash yield, franking and total return before you rely on a headline percentage.
Use the free dividend yield calculator to build a portfolio estimate. Then use the checks below to decide whether the inputs deserve your trust.
Dividend yield formula
Dividend yield (%) = Annual cash dividend per share / Share price x 100
A fictional company pays two dividends of $0.60 per share over 12 months. At a $24 share price:
$1.20 / $24 x 100 = 5%
If you hold 800 shares, estimated annual cash income is:
800 x $1.20 = $960
That $960 is an annual figure based on the selected dividend input. Payment dates may split it unevenly, and future dividends can change.
Choose the right dividend input
The same formula produces different answers depending on which dividend you use.
Trailing yield
Trailing yield uses cash dividends paid over the previous 12 months. It is grounded in actual payments, but it can mislead when the period includes a special dividend or when the company has since cut its payout.
Forward yield
Forward yield uses an announced or estimated future annual dividend. It can better reflect a known change, but an estimate is not cash in hand. Label the source and date because earnings, boards and payout policies can change.
Indicated yield
An indicated yield often annualises the latest regular payment. If the last half-year dividend was $0.70, the indicated annual dividend may be $1.40. That assumes the next payment matches the last one. It can overstate income for cyclical companies.
For a useful comparison, calculate trailing and forward yield side by side. If they differ sharply, investigate why before ranking the stock.
How franking changes the Australian comparison
Australian dividends may carry franking credits for company tax already paid. A grossed-up yield shows the cash dividend plus the attached credit as a percentage of price.
For a dividend franked at a company tax rate of 30%:
Franking credit = Cash dividend x Franking percentage x 30 / 70
Using the $1.20 annual dividend and $24 price:
- Cash yield: $1.20 / $24 = 5.00%
- Fully franked credit: $1.20 x 30 / 70 = $0.5143
- Grossed-up dividend: $1.7143
- Grossed-up yield: $1.7143 / $24 = 7.14%
With 50% franking, the credit would be $0.2571 and the grossed-up yield would be 6.07%.
Grossed-up yield is a comparison input, not the cash deposited in your account. Your tax outcome depends on eligibility and circumstances. Read franking credits explained before treating the credit as spendable income.
Yield is only one part of total return
Suppose you buy the fictional stock at $24, receive $1.20 in cash dividends, and it finishes the year at $20.
- Dividend income: +$1.20 per share
- Price change: -$4.00 per share
- Simple pre-tax total: -$2.80 per share, before fees
- Simple return: -$2.80 / $24 = -11.67%
The 5% starting yield did not protect the investment from a 16.67% price fall. A high yield can coexist with a negative total return.
Now suppose the price finishes at $26. The same dividend plus the $2 price gain produces $3.20 per share, or 13.33% before fees and tax. Yield helps describe income; total return captures income and price movement together.
Check whether the dividend can be sustained
No single ratio proves that a dividend is safe. Review several signals.
Earnings and cash flow coverage
The payout ratio compares dividends with earnings. A $1.20 dividend against $2 earnings per share gives a 60% payout ratio. For businesses with volatile earnings, compare dividends with free cash flow across a cycle as well.
An unusually high payout needs explanation. It may suit a mature business, reflect a temporary earnings dip or signal that the payment is under pressure.
Debt and reinvestment needs
A company can maintain a dividend for a while by increasing debt or reducing investment. Check whether interest costs, capital expenditure and balance-sheet commitments compete with distributions.
Ordinary versus special dividends
Separate recurring payments from specials. If the fictional company paid a normal $0.80 plus a one-off $0.40, the 5% trailing yield overstates the recurring run rate. At the same $24 price, the ordinary component yields 3.33%.
Dividend history and business cycle
A five-year chart gives more context than one payment, but the next dividend can still change. Compare payments with earnings and cash flow during weak as well as strong periods.
Spot a high-yield trap
Yield rises when price falls, even if the dividend has not improved. A stock paying $1.20 yields 5% at $24 and 10% at $12. The market may expect the next dividend to fall.
Before treating a double-digit yield as cheap income, ask:
- Did the share price fall after weaker earnings or higher debt?
- Does the trailing figure contain a special dividend?
- Has management announced a lower payment?
- Are consensus forecasts carrying unusual uncertainty?
- Would a 30% dividend cut still leave the investment attractive?
Run a simple sensitivity check. At $12, a cut from $1.20 to $0.70 reduces forward yield from 10% to 5.83%. That is still only the income side of the decision.
Use the calculator inputs carefully
On Swingfolio's dividend calculator, search for a stock, enter the number of shares and review the displayed price and dividend information. You can add several holdings and choose a display currency. The summary estimates portfolio value, annual dividend income, average yield and franking credits where available. It also shows an income projection based on historical dividend growth when sufficient data exists.
Treat quoted prices, dividend history and projections as inputs to verify. The projection is hypothetical and a historical growth rate can reverse. For a manual scenario, vary the share count or test a lower dividend outside the calculator before relying on the result.
Dividends in a swing trade
For a position held over an ex-dividend date, the quoted price commonly adjusts for the distribution, although market movement can obscure the exact effect. Do not treat the dividend as free return.
Check the ex-date before setting a stop or comparing the next session's price. Record the dividend separately from trading P&L so you can see whether the setup worked without the income payment.
Dividend stock review checklist
- State whether the yield is trailing, forward or indicated
- Separate ordinary and special dividends
- Confirm the price and calculation date
- Calculate annual cash income from the share count
- Compare cash yield with grossed-up yield where relevant
- Review payout, free cash flow, debt and reinvestment needs
- Test a dividend-cut scenario
- Combine income with price change for total return
- Check the ex-dividend date for shorter-term trades
Frequently asked questions
Is a higher dividend yield better?
No. A high yield may come from a falling price, a special dividend or an unsustainable payout. Compare the expected income with business strength and possible capital loss.
Should I use my purchase price or today's price?
Current yield uses today's price and helps compare current opportunities. Yield on cost uses your purchase price and describes your personal history. Do not substitute yield on cost when deciding whether the capital still earns an attractive return today.
Does franked yield equal my after-tax return?
No. Grossed-up yield includes the attached credit for comparison. Your usable tax benefit depends on your circumstances and eligibility.
Calculate, then challenge the assumptions
Run the income estimate, label the dividend period and test what happens if the payout or price changes. Swingfolio's calculator helps you organise the inputs; your sustainability review decides whether the headline yield is meaningful. Start the 30-day trial when you want income and trade records kept beside the decisions behind them.
This article is general information and not tax advice.