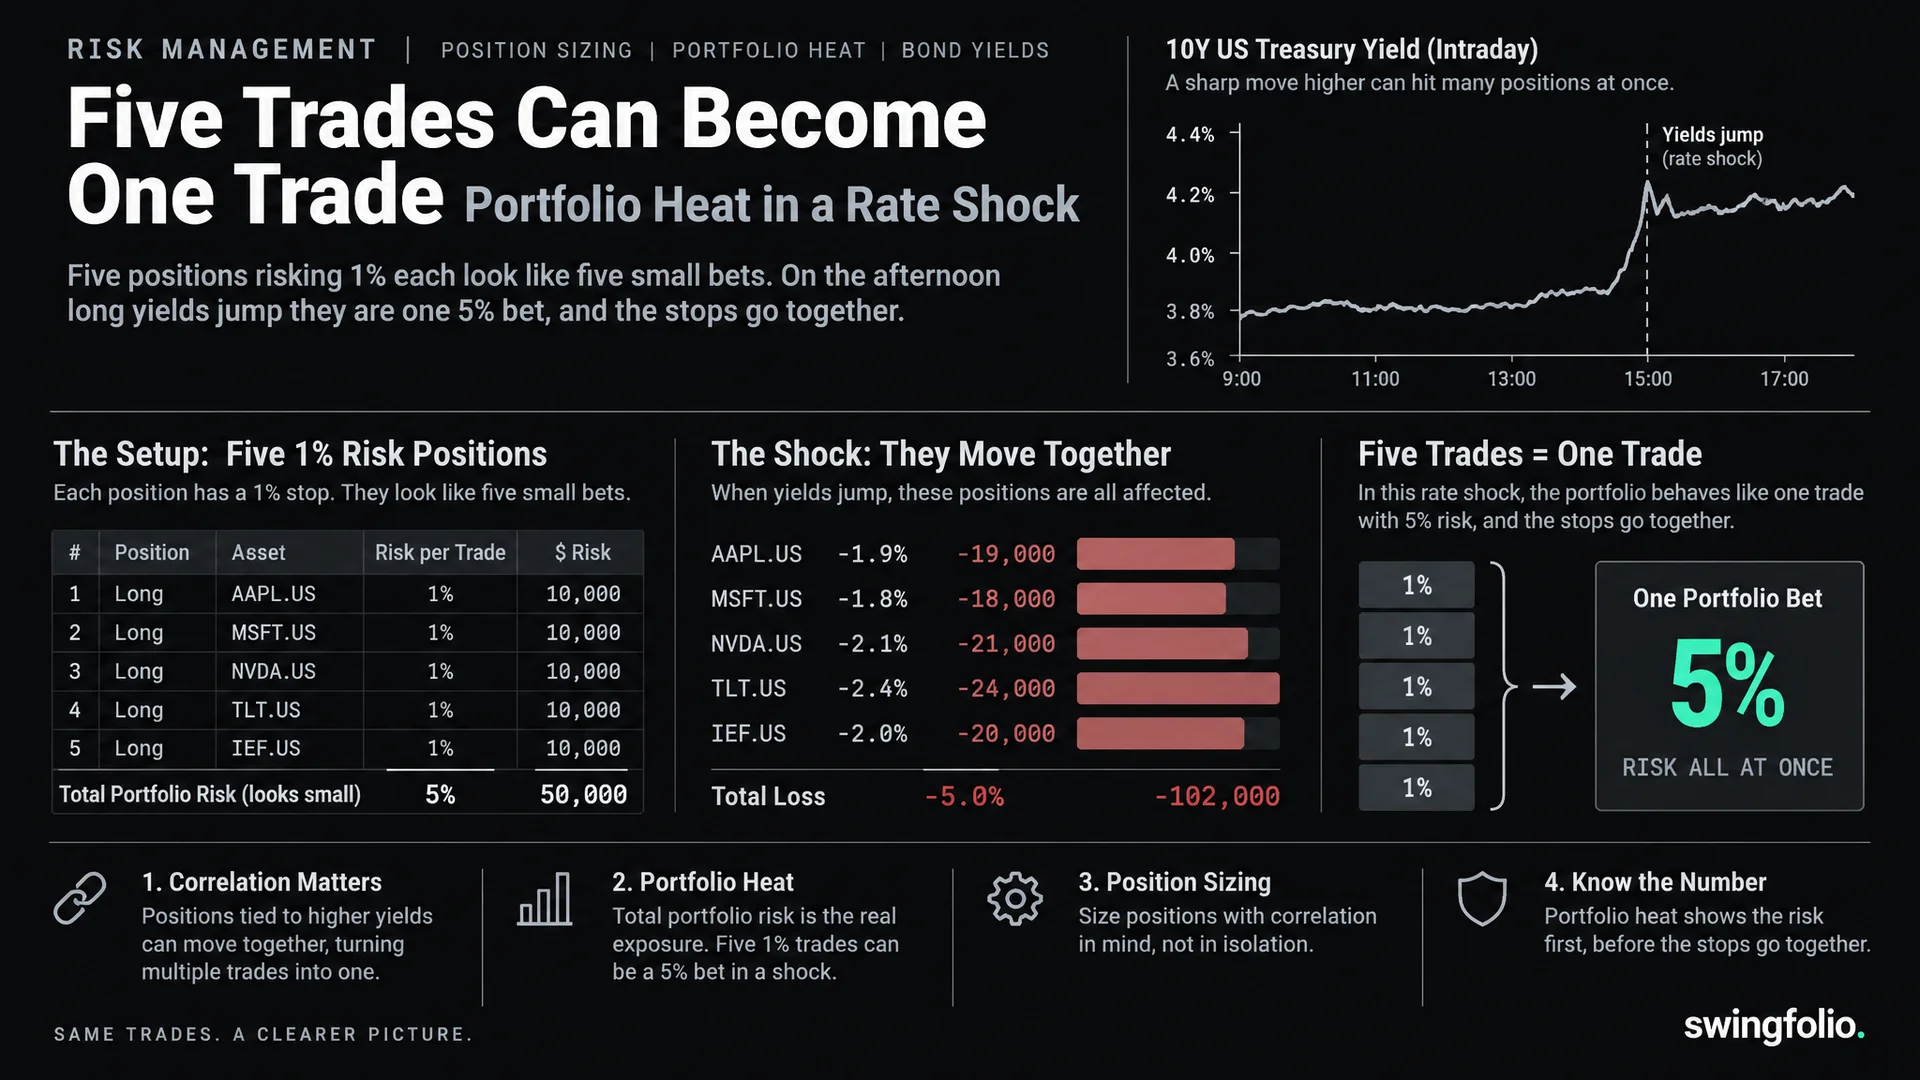
Five positions, each risking one per cent, look like five small bets. On the afternoon long yields jump, they are one bet of five per cent, and the stops go together.
That is the whole argument of this post. The rest is the arithmetic, the reason it happens, and the one number on a trades page that shows it before the afternoon arrives.
What changed in September
Long term government bonds now pay more than 5% in one of the largest markets in the world. The ten year passed that level in mid September, its highest since 2007, and real long rates in at least one other major market sit at their highest in more than fifteen years (Saxo Market Quick Take, 15 September 2026; ABC markets blog, 15 September 2026; RBA Monetary Policy Board minutes, 11 August 2026).
The number itself is not the point for a swing trader. What matters is what a move that size does to a book of shares. When the price of money moves that far, it stops being background. Every position ends up priced off it, because the discount rate on future profits went up for every company at once.
Why stops fail together
Most of us learn to size a trade on its own. Pick the entry, place the stop, work out how many shares put one per cent of the account at risk between the two, and move on to the next idea. Each trade carries its own reason to fail: a missed result, a broken level, a downgrade. On a normal week that assumption holds, and the stops get hit one at a time, weeks apart.
A rate shock is not a normal week. On the day long yields jump, every stock gets marked down for the same reason on the same day. The stops do not fail one at a time. They fail together, in one session, and the per trade sizing that looked careful on Monday turns out to have described five copies of the same risk.
The arithmetic on a hypothetical book
Take a $50,000 account with five open positions, each sized to lose 1% of the account at its stop.
1% of $50,000            = $500 at risk per position
5 positions x $500       = $2,500 total open risk
$2,500 / $50,000         = 5.0% of the account
Long yields jump. All five stocks fall and all five stops are hit in the same session. The book loses $2,500, 5% of the account, in one day, and no single trade was reckless. The book was.
Now take a trader who caps total open risk at 3% before adding a fifth position:
3% of $50,000            = $1,500 maximum open risk
4 positions x $500       = $2,000, over the cap
The fifth trade never gets opened, and the worst case on the same afternoon is $1,500 rather than $2,500. Same market, same stocks, same per trade discipline. The difference is one number checked before the entry.
The example is hypothetical. No security is named and the yields are not tied to a date, because the mechanism does not depend on either.
The number that matters is the risk across the whole book
Risk per trade answers the question "how much do I lose if this one is wrong?". It says nothing about how many of them can be wrong at once. On the days that matter, when one force prices every position, the answer is all of them.
Total open risk, sometimes called portfolio heat, is the sum of every open position's distance to its stop, expressed as a share of the account. It is the only figure that describes the afternoon in the example above before it happens. A per trade cap of 1% and a book cap of 3% are different rules, and only the second one limits the correlated loss.
None of that says five positions is too many, or that 3% is the right cap. Those are strategy decisions. The point is narrower: whichever cap you choose, the number to check before the next entry is the risk across everything already open, not the risk on the next trade.
Where it lives in Swingfolio
Swingfolio adds up the open risk on every position and shows it as portfolio heat on the trades page. The gauge runs from safe through caution to danger as the total climbs, using thresholds shared with the mobile app, and the dashboard carries a compact version of the same gauge in its KPI bar. Open it before the next entry and the book tells you whether there is room, in the same units the example above uses.
What to watch this week
The move in yields that prompted this post is a reached level, not a forecast. Whether it holds or reverses does not change the mechanism. The next time long yields move sharply in either direction, the positions in a share book will move together, and the stops placed one at a time will be tested all at once.
General information only. Not financial advice.
Sources
- Saxo, "Market Quick Take: AI warning hits chips as ten-year tops 5% before Fed", 15 September 2026.
- ABC News markets blog, 15 September 2026: US 10-year bond yields at their highest since 2007.
- Reserve Bank of Australia, Monetary Policy Board minutes, 11 August 2026: real long term rates at their highest in more than fifteen years.
- The account, positions and losses in the worked example are hypothetical.