What Is Portfolio Heat?
Portfolio heat is the total percentage of your trading account at risk across all open positions. It measures the gap between your entry prices and stop losses, aggregated as a percentage of your total account value.
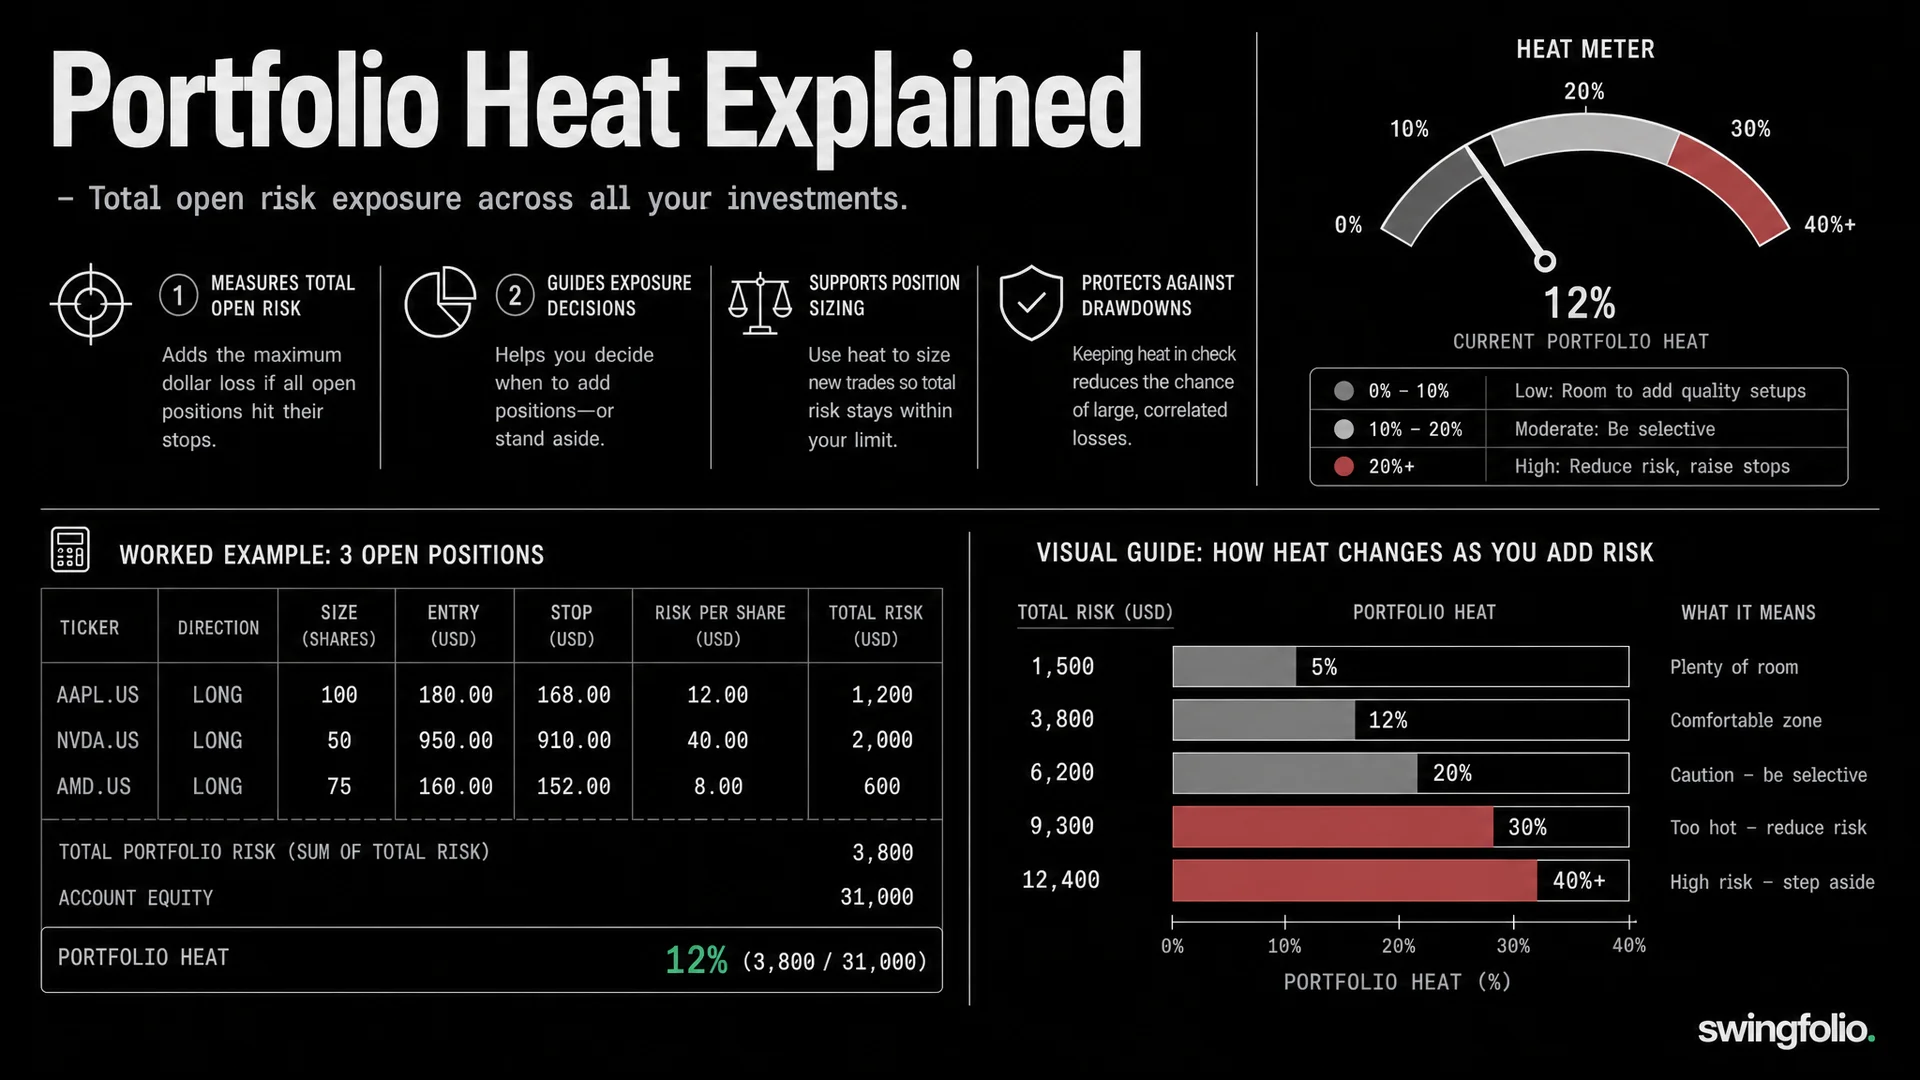
If you have four open positions each risking 2% of your account, your portfolio heat is 8%. If every open position hit its stop loss at the same time, you would lose 8% of your account.
Most portfolio trackers and spreadsheets do not calculate portfolio heat. Understanding how it works gives you a clearer picture of your exposure than position size or P&L alone.
Why Portfolio Heat Matters
Concentration Risk
Individual position risk (the amount you risk on a single trade) is only part of the picture. You might size every trade at 1.5% risk, which feels conservative. But if you have six positions open, your total heat is 9%. If those positions are correlated (all in the same sector or all responding to the same market catalyst) a single adverse move can hit multiple stops at once.
Portfolio heat makes this aggregate risk visible. It forces you to consider total exposure before entering the next trade.
Drawdown Control
Drawdowns in trading are inevitable. Controlling their depth is what separates sustainable trading from account destruction. If your portfolio heat sits at 15%, a bad week where multiple stops hit can create a 10-15% drawdown that takes weeks to recover from. Keep heat below 8%, and the same scenario produces a smaller drawdown with a faster recovery path.
Decision Clarity
One of the hardest decisions in active trading is whether to take a new trade when you have several open positions. Without a heat framework, this decision is driven by emotion: excitement about a setup overrides risk awareness. With a defined heat limit, the decision becomes mechanical. If adding the trade pushes heat above your limit, you wait. The setup will come around again. Your capital might not.
How to Calculate Portfolio Heat
The formula for individual position heat is:
Position heat = (Entry price - Stop loss) / Entry price x Position size / Account value x 100
For a short trade, reverse the entry and stop loss values. Then sum the heat of all open positions to get your total portfolio heat.
Take a $50,000 account with three open positions:
- Position A: 200 shares at $25, stop at $23.50, risk is $300, heat is 0.6%- Position B: 100 shares at $48, stop at $44, risk is $400, heat is 0.8%- Position C: 150 shares at $32, stop at $30, risk is $300, heat is 0.6%
Total portfolio heat: 2.0%. You have significant room to add positions without exceeding typical heat limits.
Common Heat Limits
There is no universal rule, but common ranges among experienced swing traders:
- Conservative: 4-6%: fewer concurrent positions, tighter risk control, suitable for traders in drawdown recovery or building a track record- Moderate: 6-8%: a common range for swing traders running three to six positions- Aggressive: 8-10%: more concurrent positions, higher total exposure, suitable for traders with a long positive track record and high win rate strategies
The right limit depends on your strategy, win rate, correlation between positions, and personal risk tolerance. Define a limit and use it as a gating mechanism for new trades.
Using Heat to Decide on New Positions
Heat is most useful as a go/no-go filter before entering new trades:
- Check your current portfolio heat before evaluating a new setup- Calculate projected heat if you add the new position at your planned size and stop- If the projected heat exceeds your limit, reduce the position size to fit or pass on the trade- If the projected heat is within your limit, proceed with the trade evaluation
This prevents the common scenario where you take a great setup at the worst possible time because you are overexposed. Good setups appear on a regular basis. Recovering from a deep drawdown caused by excessive heat takes much longer.
How SwingFolio Tracks Portfolio Heat
Calculating heat across multiple positions before every new trade is tedious, and tedious processes get skipped. SwingFolio calculates portfolio heat from your open positions and their stop losses. Your dashboard shows total heat in real time, updated as positions are opened, closed, or adjusted.
You can set heat limits and receive warnings when you approach your threshold. The heat calculation factors in partial exits and stop adjustments, so it stays accurate as your positions evolve.
For a closer look at how portfolio heat tracking works in SwingFolio, see the full feature page. If you are evaluating your risk management workflow, see how SwingFolio handles risk visibility across your account.