Why Position Sizing Matters More Than Stock Picking
Two traders can have the exact same stock picks, the exact same win rate, and wildly different account outcomes. The difference is position sizing.
Position sizing determines how much of your account you risk on each trade. Get it right, and a string of losses is a manageable drawdown. Get it wrong, and three bad trades can put you in a hole that takes months to recover from.
The concept is straightforward: risk a fixed percentage of your account on every trade, and let the distance between your entry price and stop loss determine how many shares you buy. This keeps your dollar risk consistent regardless of stock price or volatility.
The Position Size Formula
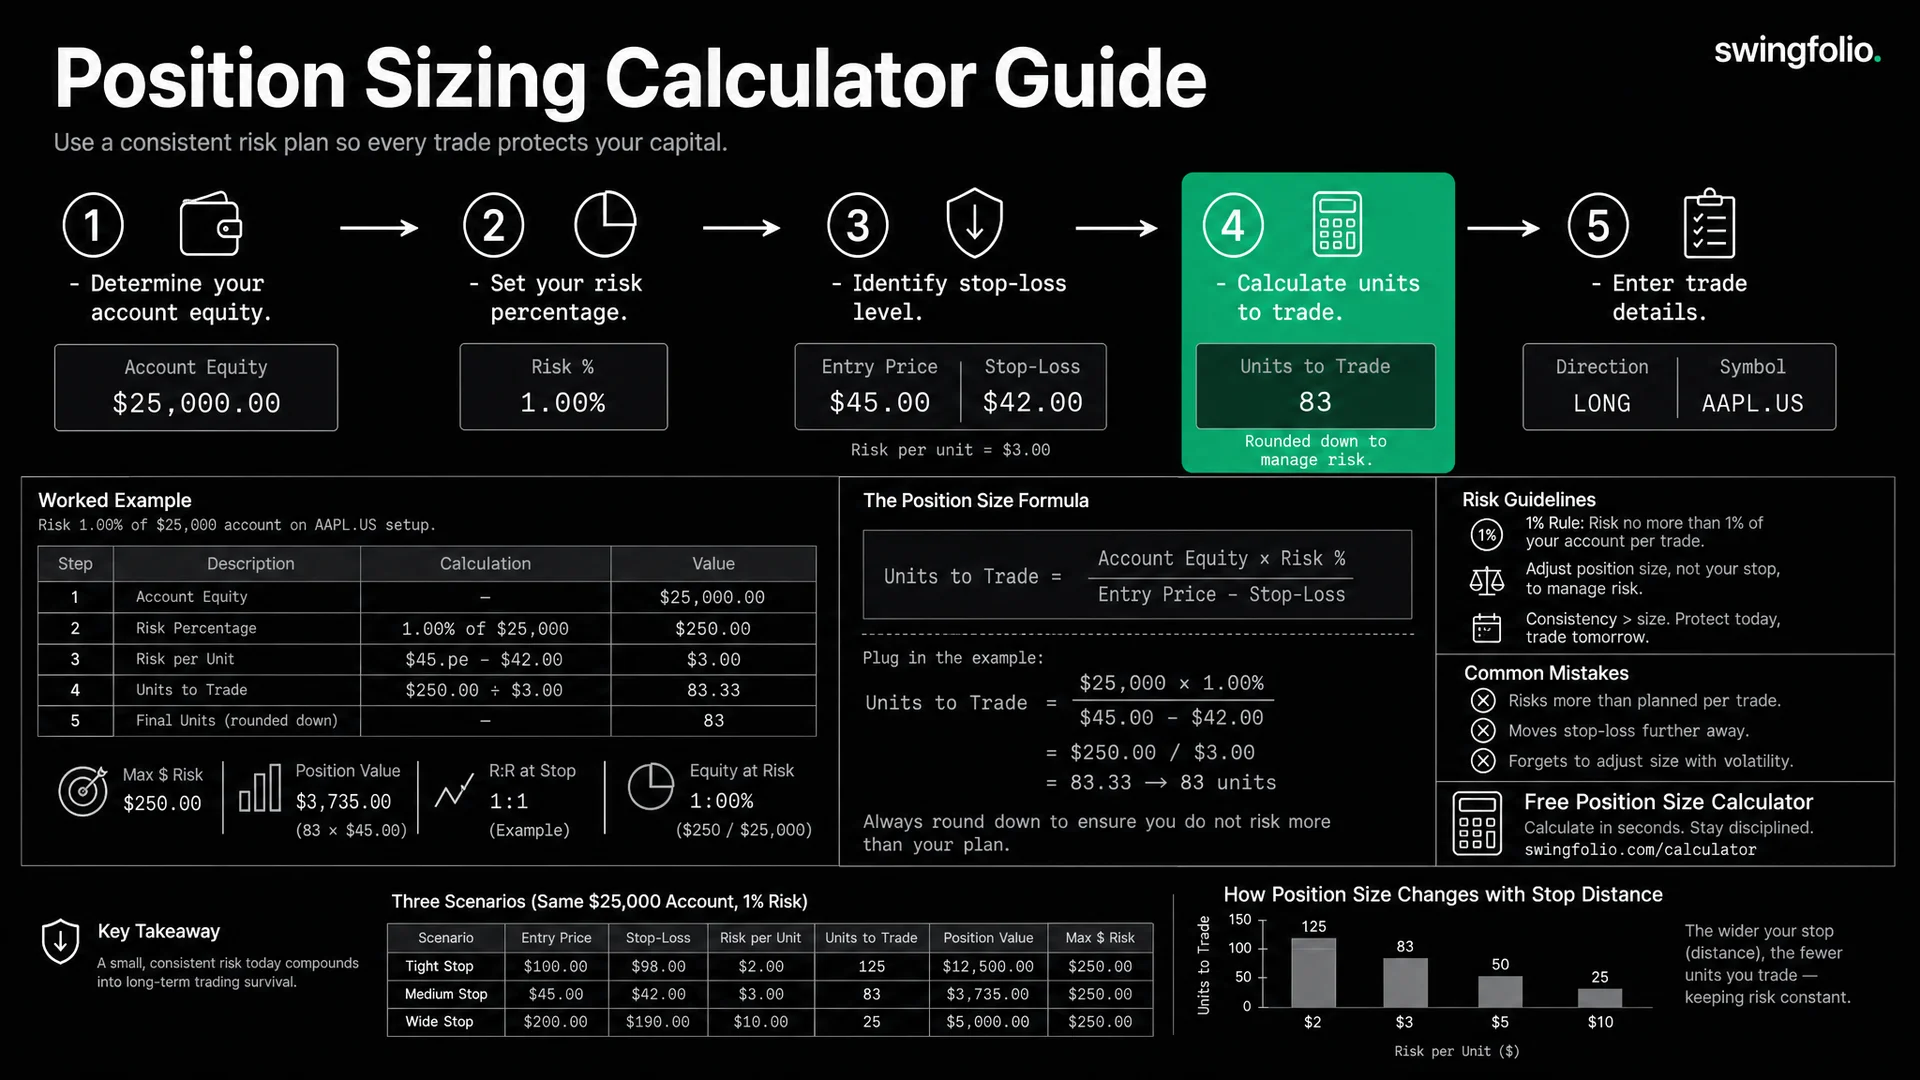
The core formula is:
Position Size (units) = Risk Amount / (Entry Price - Stop Loss Price)
Where:
- Risk Amount = Account Balance x Risk Percentage
- Entry Price = The price you plan to buy at
- Stop Loss Price = The price at which you will exit if the trade goes against you
For short trades, the formula inverts: Risk per unit = Stop Loss Price - Entry Price.
The 1% Rule
The most common risk management guideline is to risk no more than 1% of your account on any single trade. Some traders use 0.5% (more conservative) or 2% (more aggressive). The exact percentage depends on your strategy, win rate, and risk tolerance.
Here is why 1% works as a starting point. If you lose 10 trades in a row at 1% risk each, you have lost approximately 10% of your account. That is painful but recoverable. If you were risking 5% per trade, 10 consecutive losses would wipe out roughly 40% of your account, and you now need a 67% gain just to get back to breakeven.
Consecutive losing streaks of 5-10 trades are normal, even for strategies with a 50%+ win rate. Position sizing is what ensures those streaks do not end your trading career.
The Kelly Criterion (Brief Overview)
The Kelly Criterion is a mathematical formula for optimal bet sizing:
Kelly % = Win Rate - (Loss Rate / Win-Loss Ratio)
Where Win-Loss Ratio = Average Win / Average Loss.
For example, if your win rate is 55%, your average win is $800, and your average loss is $400:
- Kelly % = 0.55 - (0.45 / 2.0) = 0.55 - 0.225 = 0.325 (32.5%)
In practice, traders use "half Kelly" or "quarter Kelly" because the full Kelly amount produces extreme drawdowns. A quarter Kelly from the example above would be about 8% -- still more aggressive than most swing traders would use.
The Kelly Criterion is useful as a theoretical ceiling. If your strategy's Kelly percentage is below 0, you have no edge and should not be trading that strategy at all. If it is positive, it confirms you have a statistical edge and gives you an upper bound on position sizing.
For most swing traders, a fixed 1-2% risk per trade is simpler and more practical than running Kelly calculations on every trade.
Three Worked Examples
Example 1: Standard ASX Trade
Setup:
- Account balance: $50,000
- Risk per trade: 1%
- Stock: CBA.AU trading at $130.00
- Stop loss: $126.00 (3.1% below entry)
Calculation:
- Risk amount = $50,000 x 1% = $500
- Risk per share = $130.00 - $126.00 = $4.00
- Position size = $500 / $4.00 = 125 shares
- Position value = 125 x $130.00 = $16,250 (32.5% of account)
Notice that 125 shares of CBA at $130 uses 32.5% of the account, but only 1% is at risk. The position size is large because the stop is tight relative to the share price.
Example 2: Smaller Account
Setup:
- Account balance: $15,000
- Risk per trade: 1%
- Stock: PLS.AU trading at $3.20
- Stop loss: $2.95 (7.8% below entry)
Calculation:
- Risk amount = $15,000 x 1% = $150
- Risk per share = $3.20 - $2.95 = $0.25
- Position size = $150 / $0.25 = 600 shares
- Position value = 600 x $3.20 = $1,920 (12.8% of account)
With a smaller account, brokerage becomes a more significant factor. At $9.50 per trade (typical flat-fee broker), brokerage on this $1,920 position represents 0.5% of the trade value each way, or about $19 round trip. That eats into a $150 risk budget meaningfully. Smaller accounts need to account for brokerage when calculating actual risk.
Example 3: Wide Stop (How Position Size Shrinks)
Setup:
- Account balance: $50,000
- Risk per trade: 1%
- Stock: FMG.AU trading at $18.50
- Stop loss: $16.00 (13.5% below entry -- below a major support level)
Calculation:
- Risk amount = $50,000 x 1% = $500
- Risk per share = $18.50 - $16.00 = $2.50
- Position size = $500 / $2.50 = 200 shares
- Position value = 200 x $18.50 = $3,700 (7.4% of account)
Compare this to Example 1. Same account, same 1% risk, but the wider stop ($2.50 vs $4.00 risk per share on a cheaper stock) produces a much smaller position relative to the account. This is exactly how it should work. A wider stop means more room for the trade to move against you, so you compensate by buying fewer shares.
This is the mechanism that keeps your dollar risk consistent. Tight stops allow larger positions. Wide stops force smaller positions. The risk amount stays the same.
Common Position Sizing Mistakes
Fixed Dollar Amounts Regardless of Stop Distance
Buying $5,000 worth of every stock regardless of where the stop loss is. If one trade has a 3% stop and another has a 15% stop, the second trade risks 5x more dollars. This produces inconsistent risk and outsized losses on the wide-stop trades.
Ignoring Brokerage
On a $150 risk budget (1% of $15,000), round-trip brokerage of $19 represents 12.7% of your risk. For small accounts, factor brokerage into the risk calculation:
Adjusted Risk Amount = (Account Balance x Risk %) - (Estimated Round-Trip Brokerage)
In the example above: $150 - $19 = $131 available for market risk. Position size = $131 / $0.25 = 524 shares instead of 600.
Sizing Based on Conviction
"I really like this setup, so I will risk 3% instead of 1%." This is how accounts blow up. Your conviction about a trade has no statistical correlation with the trade's outcome. The whole point of fixed-percentage risk is to remove subjective judgment from the sizing decision.
Not Adjusting for Portfolio Heat
Position sizing for a single trade is only half the picture. If you have five open positions each risking 1%, your total portfolio risk is up to 5%. If all five are in the same sector (e.g., mining stocks), a sector-wide selloff could trigger all five stops simultaneously. Track your total open risk (portfolio heat) alongside individual trade risk.
Free Position Size Calculator
Use SwingFolio's free Position Size Calculator to run these calculations instantly. Enter your account balance, risk percentage, entry price, and stop loss price, and it returns the exact position size, position value, and risk amount.
The calculator is free to use without an account.
How SwingFolio Automates Position Sizing
When you log a trade in SwingFolio, position sizing is calculated automatically.
Here is how it works:
- You set your risk parameters in your strategy (e.g., 1% risk per trade, default stop loss at 7%).
- When you open the trade form and select that strategy, SwingFolio pre-fills the stop loss based on your strategy's default percentage.
- As you enter the entry price and stop loss, SwingFolio calculates the recommended position size in real time.
- The dashboard's portfolio heat metric shows your total open risk across all positions, so you can see whether adding this trade keeps you within your overall risk limits.
If you adjust the stop loss, the recommended position size updates automatically. Move the stop tighter, and the position size increases. Move it wider, and the position size decreases. The dollar risk stays at your defined percentage.
This removes the manual calculation step and the temptation to override the formula based on gut feeling. The math runs every time, consistently.
Position Sizing and R-Multiples
Position sizing and R-multiples work together. The R-multiple of a trade is calculated as:
R = (Exit Price - Entry Price) / (Entry Price - Stop Loss)
If you sized the position correctly at 1% risk, then:
- A +1R trade made you 1% of your account
- A +2R trade made you 2% of your account
- A -1R trade lost you 1% of your account
This is the power of consistent position sizing. When you risk the same percentage on every trade, your R-multiples translate directly to account percentage returns. A 2R winner always means the same thing to your account, regardless of which stock it was or what the share price was.
SwingFolio calculates R-multiples for every trade that has a stop loss defined. Your dashboard shows your average R across all closed trades, which is one of the most useful single numbers for measuring your trading edge.