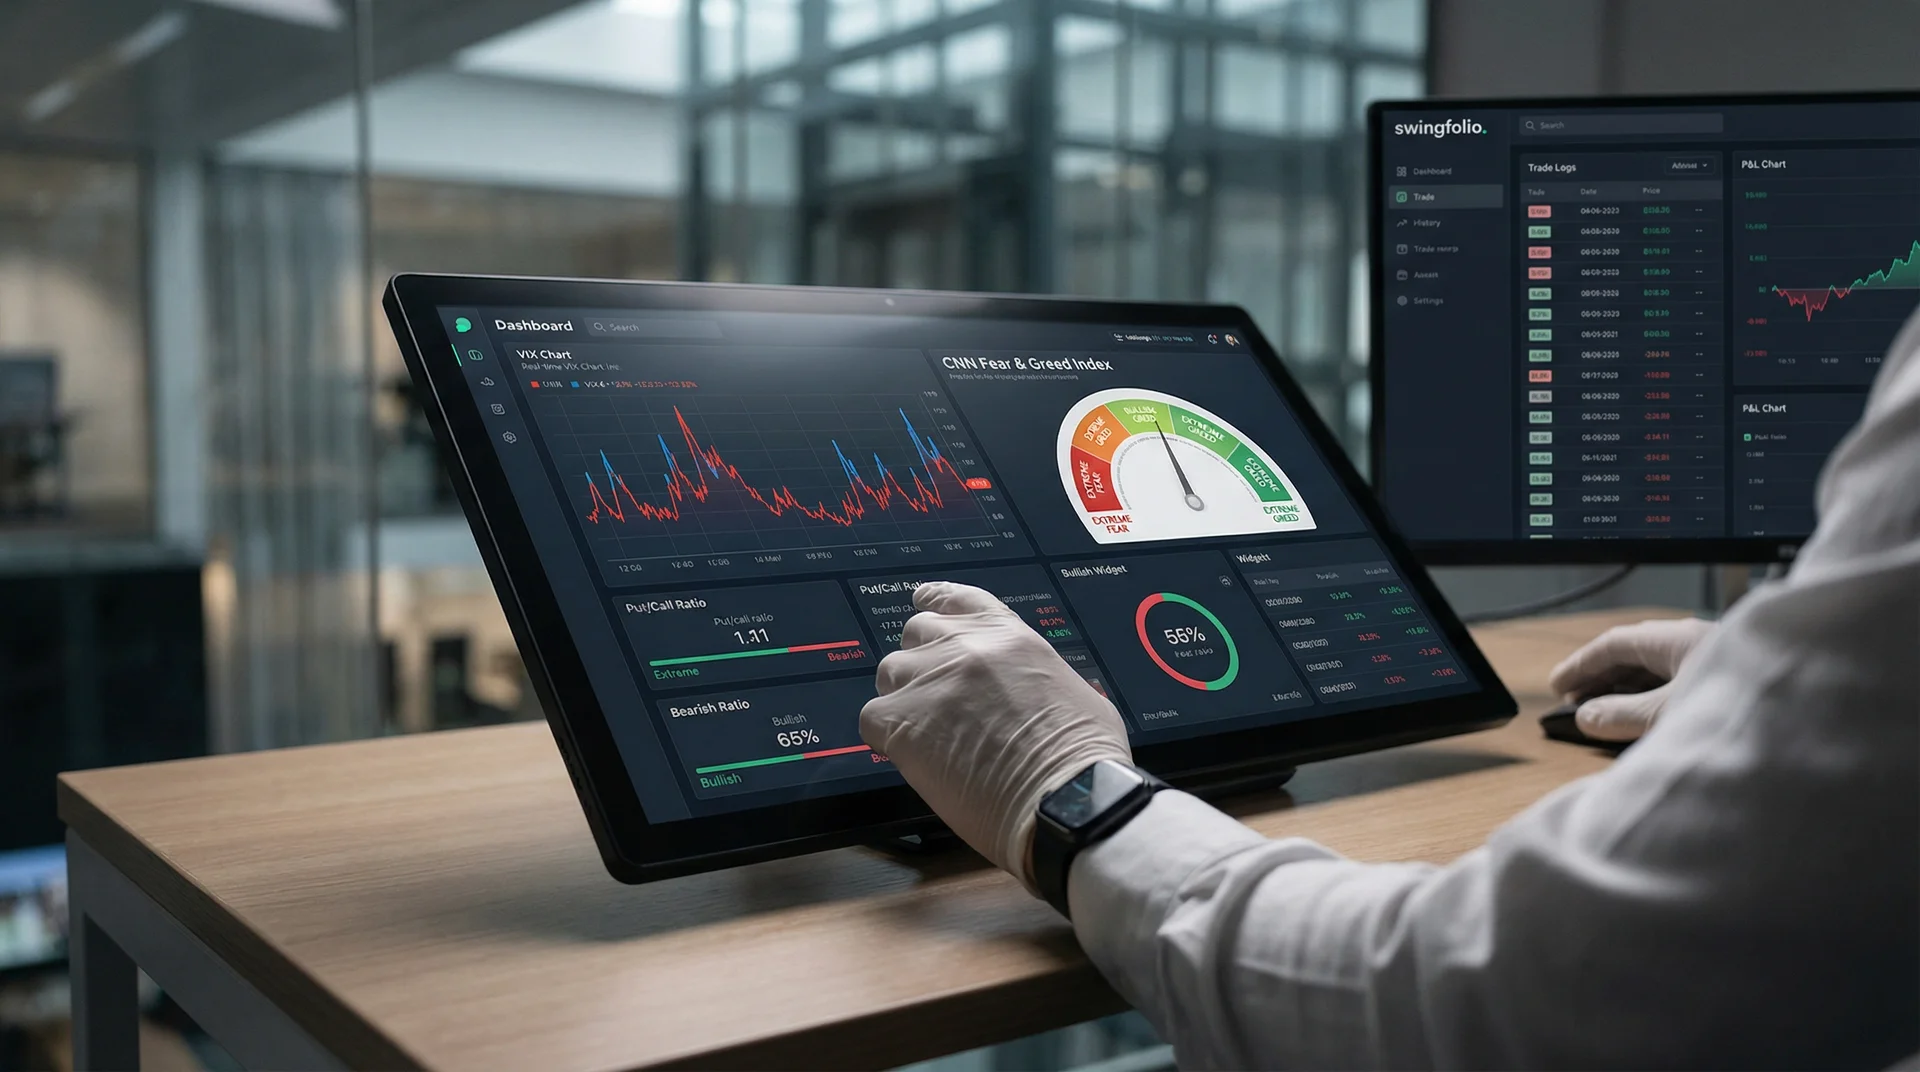
Four gauges get quoted as if they all read the same dial. They do not. The VIX is calculated from option prices, the AAII survey is a poll of individual investors, CNN's index averages seven separate inputs, and the put/call ratio counts contracts traded. Knowing which one measures what decides whether a reading means anything to your next trade.
What market sentiment is
Sentiment is the aggregate positioning and stated expectation of market participants, measured indirectly. Nobody surveys everyone, so every gauge is a proxy: what options cost, what a sample of investors says, how many stocks are advancing.
Readings sort into three states.
- Bullish: expectations skew towards higher prices, and positioning follows.
- Bearish: expectations skew lower, and protection gets bought.
- Neutral: neither side dominates, and the gauges sit near their averages.
The premise behind watching any of them is that positioning at an extreme leaves fewer participants able to push further in that direction. That is a premise, not a proven mechanism, and the publishers below are careful about how far they take it.
Contrarian and confirmation readings
The same number gets used two ways.
Contrarian readings
An extreme is read as a warning that one side of the trade is crowded. AAII, whose survey has run weekly since 1987, states the case for its own data plainly: extreme sentiment is a useful but not definitive signal, and should be considered alongside other indicators.
Confirmation readings
A moderate reading moving with price is read as participation behind the trend, rather than a thin move against consensus.
Neither reading tells you when. That limitation runs through the rest of this article.
Sentiment indicators traders watch
VIX
Cboe describes the Cboe Volatility Index as a measure of market expectations of near-term volatility conveyed by S&P 500 index option prices. It is a volatility expectation, not a direction. A high VIX says the options market is pricing wide moves, not that the wide move is down.
The levels traders call low, normal and high are conventions rather than defined thresholds. Whatever bands you use, apply them to the same index over the same lookback, and write them down before you need them.
Put/call ratio
Cboe publishes put and call volume and open interest daily, along with the ratios calculated from them. There is no single put/call ratio. The total, index and equity ratios are separate series, and on the same day they read differently.
That is why a threshold copied from an article often fails. A level that means something on the equity ratio means something else on the index ratio. Pick one series, watch it long enough to know its own range, and judge readings against that range.
AAII sentiment survey
The American Association of Individual Investors polls its members once a week and publishes the split. The question is whether the direction of the stock market over the next six months will be up (bullish), no change (neutral), or down (bearish). The survey has run every week since 1987, so a current reading has a long history to sit against.
AAII's own definition of an extreme is statistical rather than a round number: bearish sentiment two or more standard deviations above its mean. You can apply that test to the published history yourself, which a fixed percentage does not let you do.
The population matters. This is a poll of individual investors, so it says nothing directly about how institutions are positioned.
CNN Fear and Greed Index
CNN's index combines seven market indicators: market momentum, stock price strength, stock price breadth, put and call options, junk bond demand, market volatility, and safe haven demand. It tracks how far each one has deviated from its average, compared with how much it normally diverges. Each indicator gets equal weighting. The result is a score from 0 to 100, where 100 is maximum greediness and 0 is maximum fear.
Two of those seven inputs are already on this list. That is worth knowing before you treat the index and the VIX as independent confirmations of each other.
Market breadth
Breadth measures how many stocks are taking part in a move, rather than how far the index went.
- Advance/decline line: a running total of advancing stocks minus declining stocks.
- New highs against new lows: the count of issues making 52-week extremes on each side.
- Percentage of stocks above their 200-day moving average.
A divergence is the arithmetic case where the index makes a new high and the breadth measure does not, which means the move is carried by fewer names than the previous one. That describes the data. It says nothing about what happens next.
Applying sentiment to trades
As a filter on direction
At an extreme reading you can require more from a trade going the same way as the crowd. That might be a tighter stop, a smaller size, or a setup you would have taken on its own merits anyway.
As confirmation of a position you hold
Sentiment moving with price and still short of an extreme is the ordinary condition of a trend, so it changes nothing about the plan. When that is the answer, no action is the correct action.
As a timing input against the trend
If you are trading against the prevailing direction, an extreme reading is the least bad moment to do it. It is not a good moment. Sentiment can hold at an extreme for weeks while price keeps going.
Sentiment in a weekly routine
Weekly check
Fold the reading into the weekend review rather than the trading session.
- Note the current VIX level and where it sits in its own recent range.
- Note the Fear and Greed reading and which way it moved during the week.
- Write down any reading you would call extreme, and what you decided to do about it.
The last line is the one that pays. Without it there is no record of whether your extremes call anything, and next quarter you are guessing again.
Position adjustment
Decide the adjustment in advance and make it mechanical: a fixed reduction in size, a fixed cap on new positions in the crowded direction, or nothing at all. An adjustment invented while the gauge is at an extreme is a discretionary trade dressed as a rule.
Risk management
When an extreme reading arrives with wider daily ranges, any stop placed on market structure widens with them. A wider stop on the same dollar risk means fewer shares. That is arithmetic, and it happens whether or not you decide to act on the sentiment reading itself.
Mistakes to avoid
Acting too early
An extreme reading is a state, not a trigger. Sentiment can sit at an extreme through a multi-week move, and a position sized as though the reversal is imminent will not survive the wait.
Ignoring price
Sentiment describes the crowd's expectation. Price is the transaction record. When the two disagree, the transaction record is the one your account settles against.
Using one gauge as the whole case
These gauges overlap, as the Fear and Greed inputs show. Four correlated readings are not four independent confirmations.
Put sentiment data to work
Swingfolio does not compute a sentiment score, and the gauges above are published by the sources named beside them. What the app holds is the other half of the test: your own results, in a form you can slice.
The dashboard's market strip carries the VIX beside the major indices, with its level and its change for the session, so the reading sits on the same screen as your positions.
Every trade also gets a market regime stamped on it at entry, detected from price rather than from sentiment, and labelled Uptrend, Downtrend, Ranging or Volatile. Once you have 5 closed trades, the "Market Regime" card in Analytics charts your profit factor in each of the four. The win rate and trade count print under the chart, and the average P&L per trade and average hold appear on hover. If your counter-trend trades only work in one of them, that card is where it shows.
Pick one gauge, write down the level you would call extreme, and start recording what you did about it. Start the 30-day trial and give those notes somewhere to sit next to the trades they explain.