What Drawdown Is
Drawdown measures the decline from a peak in your account value to the subsequent trough before a new peak is reached. It answers the question: "What was the worst period I went through?"
If your account reached $50,000, then declined to $40,000 before recovering, your drawdown during that period was $10,000, or 20%.
Maximum drawdown is the largest peak-to-trough decline over the entire measurement period. It captures the worst losing stretch you experienced.
The Formula
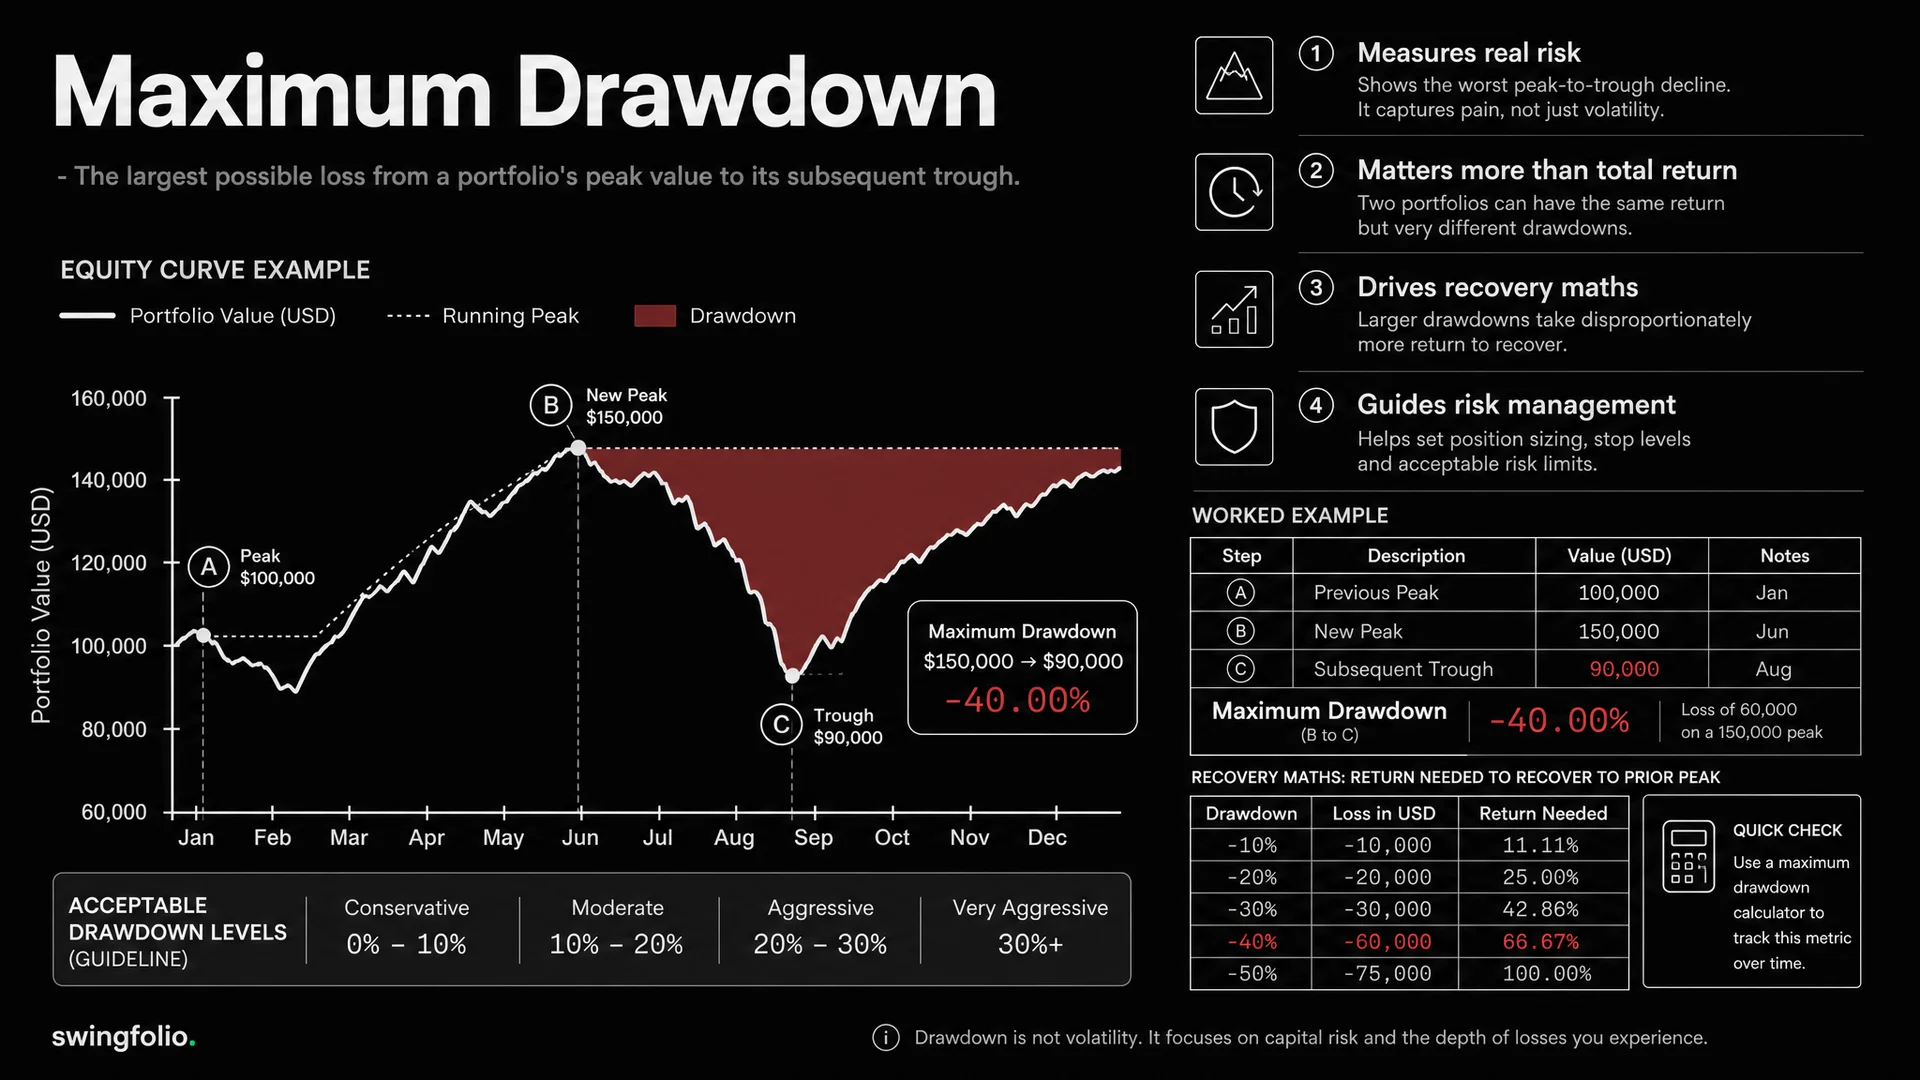
Maximum drawdown is expressed as a percentage:
Maximum Drawdown (%) = (Trough Value - Peak Value) / Peak Value x 100
Using the example above:
($40,000 - $50,000) / $50,000 x 100 = -20%
The calculation is straightforward for a single drawdown. Where it gets more involved is identifying the maximum drawdown across an entire trading history. You need to track the running peak of your account and measure the distance from that peak at every point in time.
Here is how it works step by step:
- Record your account value at the end of each day (or each trade close)
- Track the highest value reached so far (the running peak)
- At each point, calculate the percentage decline from the running peak
- The maximum of all those decline values is your maximum drawdown
Use our free drawdown calculator to run this against your own numbers.
Why It Matters More Than Total Return
Two traders both return 30% for the year. Trader A had a maximum drawdown of 8%. Trader B had a maximum drawdown of 35%.
The total return is identical. The experience of trading those two accounts was vastly different.
Trader B had to watch their account drop by more than a third before recovering. That kind of decline tests psychological limits. It creates pressure to abandon the system, increase risk to "make it back," or quit trading altogether. Most traders who experience a 35% drawdown do not recover -- not because the system cannot recover, but because they change their behaviour during the drawdown.
Trader A achieved the same return with a fraction of the pain. Their system is more consistent, more predictable, and more sustainable.
This is why professional fund managers report maximum drawdown alongside returns. Returns tell you what you made. Drawdown tells you what you had to endure to make it.
The Recovery Maths Problem
Drawdowns create an asymmetric recovery challenge. The larger the drawdown, the disproportionately larger the gain needed to recover.
| Drawdown | Gain Needed to Recover |
|---|---|
| 5% | 5.3% |
| 10% | 11.1% |
| 20% | 25.0% |
| 30% | 42.9% |
| 40% | 66.7% |
| 50% | 100.0% |
A 50% drawdown requires a 100% gain just to get back to where you started. Not a 50% gain -- a full doubling of the account. This is why managing drawdown is not optional. Once you are in a deep hole, the maths of recovery works against you.
At a 20% drawdown, you need a 25% gain. That is achievable for a competent swing trader over several months. At 40%, you need a 67% gain, which could take a year or more of solid trading. At 50%, many accounts never recover.
How to Interpret Your Drawdown
Your maximum drawdown number tells you several things about your trading.
Risk management effectiveness. A low maximum drawdown relative to your returns suggests good risk controls -- appropriate position sizing, disciplined stop losses, and portfolio-level risk management.
Strategy robustness. A system that produces large returns with small drawdowns is more likely to continue performing than one that produces the same returns with violent swings.
Psychological sustainability. You need to be honest about what drawdown level you can tolerate without changing your behaviour. If a 15% drawdown would cause you to abandon your strategy, then your position sizing needs to target a maximum drawdown well below 15%.
Acceptable Levels for Swing Traders
There is no universal "correct" maximum drawdown. It depends on your strategy, timeframe, and risk tolerance. That said, here are general guidelines for Australian swing traders:
Under 10% -- Conservative. Achievable with tight position sizing (1-2% risk per trade) and strict stop-loss discipline. Suitable for traders managing retirement savings or SMSF portfolios where capital preservation is the priority.
10-20% -- Moderate. The typical range for disciplined swing traders risking 2-3% per trade. This level is psychologically manageable for most people and allows for reasonable returns.
20-25% -- Aggressive. Common among traders with higher conviction approaches or concentrated portfolios. The recovery maths starts to bite at this level -- a 25% drawdown requires a 33% gain to recover.
Above 25% -- High risk. At this level, review your position sizing and risk management. Even professional traders with decades of experience target maximum drawdowns below this threshold.
How Position Sizing Controls Drawdown
The single most effective way to control drawdown is position sizing. If you risk 1% of your account per trade, a losing streak of 10 trades in a row costs you roughly 10% (slightly less due to the compounding effect of a shrinking account). If you risk 3% per trade, the same losing streak costs you roughly 26%.
Ten consecutive losers sounds extreme, but it is not. A strategy with a 55% win rate has a 0.34% chance of ten consecutive losses in any given sequence of ten trades. Over hundreds of trades, it becomes probable. Position sizing is how you survive the inevitable bad runs.
Tracking Drawdown in SwingFolio
SwingFolio calculates and displays your drawdown automatically. The drawdown chart on the analytics page shows your drawdown over time as a percentage, with the maximum drawdown clearly marked.
The chart plots your drawdown at each point relative to the prior peak. Periods near zero mean you are at or near new highs. Dips below zero show drawdown events. The deepest point on the chart is your maximum drawdown.
You can filter by portfolio and date range, which lets you see how drawdown varies across different accounts and market conditions. The risk metrics card also displays the current drawdown alongside the maximum, so you always know where you stand relative to your worst historical decline.