What Sharesight Does Well
Before listing what is missing, it is worth acknowledging what Sharesight handles competently. Total portfolio return, dividend income and franking credits, capital gains tax reporting, currency-adjusted performance, and benchmark comparison are all well-implemented. For the question "how is my portfolio performing overall?", Sharesight gives you a clear answer.
But active traders ask a different set of questions. And for those questions, the metrics that matter do not exist in Sharesight or any other portfolio tracker.
Here are eight metrics that change how you evaluate your trading, what each one reveals, and why a portfolio tracker was never designed to calculate them.
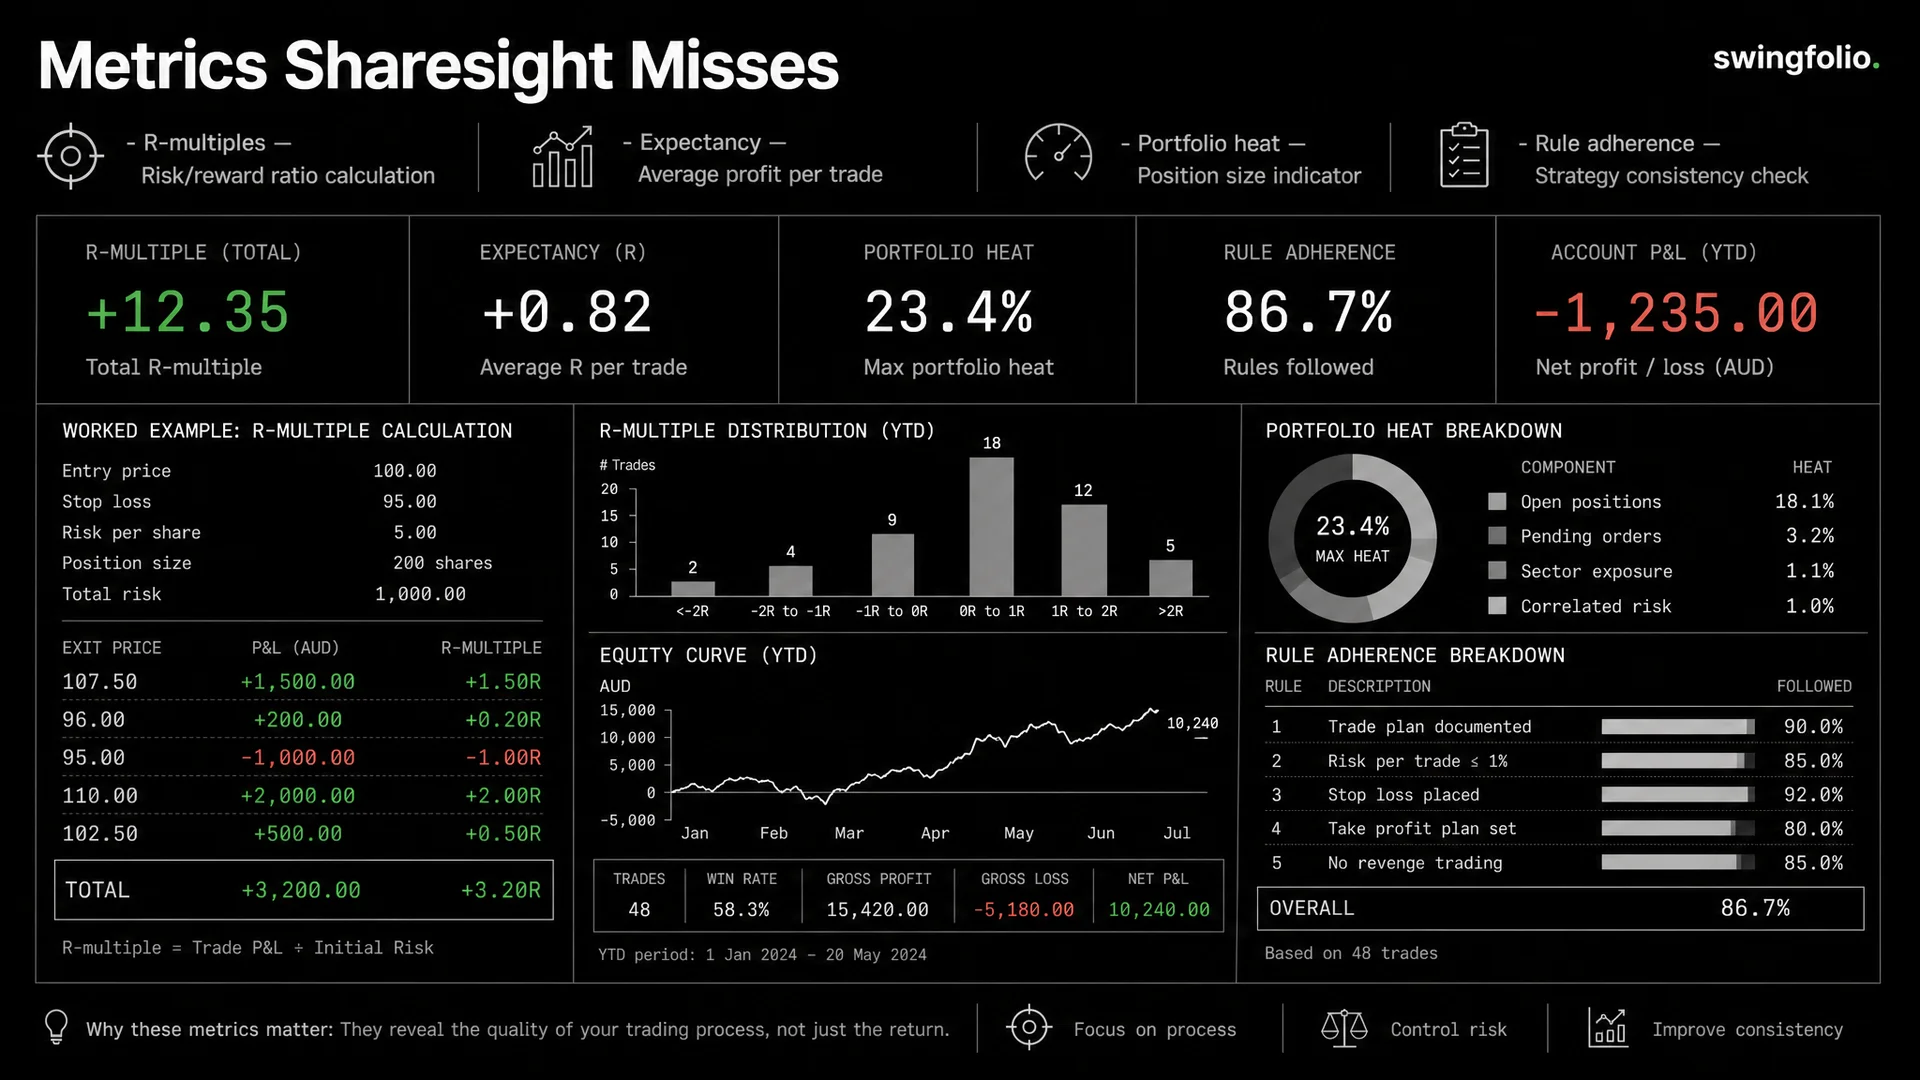
1. R-Multiple (Risk-Adjusted Return Per Trade)
What it is: The profit or loss on a trade expressed as a multiple of the initial risk taken. If you risked $200 on a trade (the distance from entry to stop loss, times position size) and made $500, that is a 2.5R winner. If you lost the full $200, that is a -1R loser.
Why it matters: Dollar P&L is misleading. A $500 profit on a $200 risk is excellent trading. A $500 profit on a $2,000 risk is mediocre. R-multiples normalise every trade against its risk, making it possible to compare trades of different sizes and stocks.
What it reveals: Your R-multiple distribution shows whether you are managing risk properly. A healthy distribution has losses clustered at -1R (honouring stops) and winners spread from 1R to 3R+. An unhealthy distribution has losses at -2R or worse and winners barely reaching 1R.
Why Sharesight cannot track it: R-multiples require knowing your stop loss at entry. Sharesight does not record stop losses, profit targets, or planned risk per trade.
2. Expectancy (Average R Per Trade)
What it is: The mathematical expectation of your trading system -- the average R-multiple you earn per trade over a large sample. Calculated as: (Win Rate x Average Winner R) minus (Loss Rate x Average Loser R).
Why it matters: Expectancy is the single number that tells you whether your trading approach makes money over time. A positive expectancy means every trade has a statistical edge. A negative expectancy means you are losing money on average, regardless of any hot streak.
What it reveals: A trader with +0.5R expectancy earns half a unit of risk on every trade, on average. Over 100 trades risking $200 each, that is $10,000 in expected profit. Expectancy combines win rate, reward size, and risk management into one figure that is far more useful than any of those numbers in isolation.
Why Sharesight cannot track it: Expectancy depends on R-multiples, which depend on knowing initial risk per trade. Since Sharesight does not store stop losses or risk per trade, it cannot calculate expectancy.
3. Portfolio Heat (Total Open Risk)
What it is: The sum of risk across all your open positions, expressed as a percentage of your portfolio. Three open trades each risking 1% means 3% portfolio heat.
Why it matters: Portfolio heat tells you how much you stand to lose right now if every trade hits its stop simultaneously. Most professional traders keep heat between 3% and 6%. Above 10% means a correlated move could trigger multiple stops and create a serious drawdown.
What it reveals: You might feel diversified holding five stocks. But if they are all miners and each risks 2%, a sector selloff could produce a 10%+ drawdown in a single day. Portfolio heat makes this concentrated risk visible.
Why Sharesight cannot track it: It requires active stop loss levels on each position. Sharesight tracks positions but not their stops.
4. Strategy Win Rate (Per-Strategy Breakdown)
What it is: The percentage of winning trades for each strategy you trade, calculated independently.
Why it matters: An overall 50% win rate is nearly useless information. It could result from one strategy winning 70% of the time and another winning 30%. The 30% strategy might still be profitable (if its winners are large enough), or it might be dragging down your results. You cannot tell without the per-strategy breakdown.
What it reveals: Strategy win rate, combined with average R per strategy, tells you whether each approach is contributing to or subtracting from your portfolio. It also helps you allocate attention and capital -- trade your best strategies more and your worst strategies less (or stop trading them entirely).
Why Sharesight cannot track it: Sharesight has no concept of "strategy." Every trade is recorded as a buy or sell on a ticker. There is no tagging system for categorising trades by the setup or methodology used.
5. Average Hold Time by Outcome
What it is: The average number of days you hold winning trades versus losing trades.
Why it matters: One of the most common performance problems in trading is the asymmetry between hold times for winners and losers. Traders tend to cut winners early (out of fear the profit will disappear) and hold losers too long (hoping for a recovery). The data pattern is consistent: many traders hold their losers 1.5 to 2 times longer than their winners.
What it reveals: If your average winning hold time is 5 days and your average losing hold time is 11 days, you have a structural problem. You are giving losing trades more time and more capital to work against you than you are giving winning trades to work in your favour. This single asymmetry explains a large portion of poor trading results.
Why Sharesight cannot track it: Sharesight records trade dates and could theoretically calculate hold times. But it does not categorise trades as winners or losers at the individual trade level (only at the holding level), and it does not compute this metric.
6. Largest Winner to Largest Loser Ratio
What it is: The size of your biggest winning trade divided by the size of your biggest losing trade, measured in R-multiples.
Why it matters: This ratio reveals whether your risk management is structurally sound. If your largest winner is 4R and your largest loser is -1R, your ratio is 4:1 -- strong. If your largest winner is 2R and your largest loser is -3R (you held through a stop), the ratio is 0.67:1 -- a serious problem.
What it reveals: A ratio below 2:1 typically means you are either cutting winners too short, letting losers run too far, or both. This is the most direct measure of whether you are following the "cut your losses, let your winners run" principle that every trader knows but few consistently execute.
Why Sharesight cannot track it: Again, this requires R-multiple data, which requires initial risk per trade.
7. Consecutive Loss Count (Drawdown Risk)
What it is: The maximum number of consecutive losing trades you have experienced, and the total R-drawdown during that streak.
Why it matters: Every trading strategy produces losing streaks. A strategy with a 50% win rate has a 12.5% chance of hitting four consecutive losses and a 3% chance of hitting five. Knowing your historical maximum consecutive loss streak helps you set realistic expectations and size positions accordingly.
What it reveals: If your strategy produces 6 consecutive losses at -1R each, that is a -6R drawdown -- a normal statistical occurrence for most win rates. If your maximum consecutive loss is 8 at -2R each (because you are not honouring stops), that is a -16R drawdown, which is a risk management failure. The distinction between normal variance and behavioural breakdown shows up clearly in consecutive loss data.
Why Sharesight cannot track it: Portfolio trackers do not sequence individual trades or analyse win/loss patterns over time.
8. Rule Adherence Score
What it is: The percentage of trades where you followed your pre-defined plan -- entered at the planned level, set the stop, honoured the stop, exited at target or according to rules, and sized the position correctly.
Why it matters: Rule adherence is one of the strongest predictors of long-term trading improvement. Traders who follow their rules at least 85% of the time tend to improve their results over time. Traders below 60% adherence tend to stagnate or deteriorate, even if their strategy is theoretically sound.
What it reveals: If your win rate is 55% on trades where you followed your rules and 30% on trades where you deviated, the data is telling you something direct: your rules work, but you are undermining them. This is the most actionable insight a trading journal produces.
Why Sharesight cannot track it: This requires recording your plan before the trade and comparing it to what actually happened. Portfolio trackers record only what happened, not what you intended.
What Sharesight CAN Tell You (And Why That Still Matters)
Sharesight's metrics are not irrelevant. Total return, dividend yield, CGT liability, and benchmark comparison are all important data points. No active trader should ignore their overall portfolio performance.
The gap is that these metrics measure outcomes. The eight metrics above measure process. Outcomes over short periods are noisy -- dominated by luck, market direction, and a few outlier trades. Process is what you control, and process quality over a meaningful sample is what predicts whether your outcomes will persist.
The ideal setup for an active Australian trader is to track both: portfolio-level metrics for the big picture, and trade-level metrics for the operational detail. Sharesight handles the first category. A trading journal like SwingFolio handles the second.
Using only portfolio metrics to evaluate active trading is like a football coach who only checks the final score without watching the game tape. You know whether you won, but you do not know why, and you do not know how to get better.
Disclaimer: This article is general information only and does not constitute financial advice. Sharesight is a registered trademark of Sharesight Limited. Feature comparisons are based on publicly available information as of early 2026. Always evaluate tools based on your own requirements.