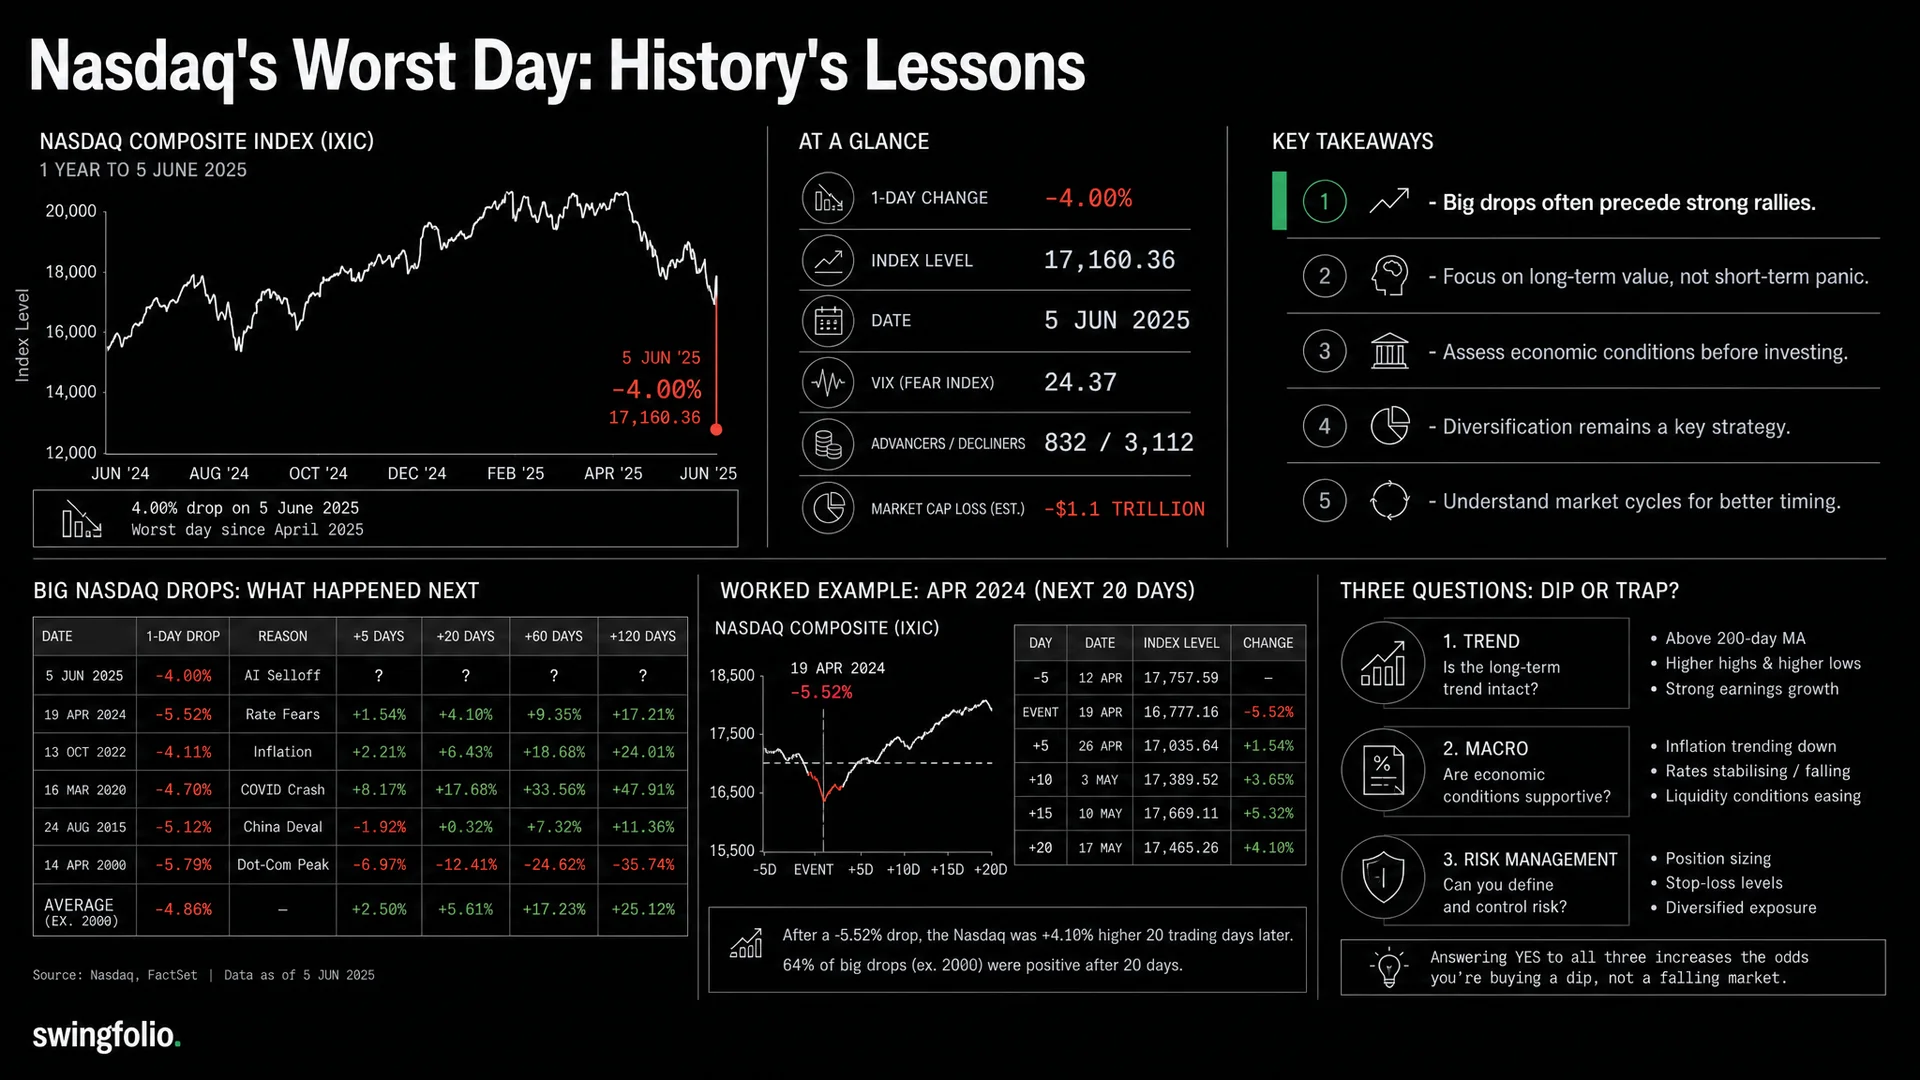
On Friday, 5 June 2026, the Nasdaq Composite closed down about 4%, its worst session since April 2025. The Nasdaq-100 fell the same amount. The selling spread across assets: the S&P 500 lost about 1.8%, the Dow dropped more than 400 points, Treasury yields jumped, Bitcoin slipped under $60,000, and gold fell too.
The trigger was good news, not bad. A hotter-than-expected May jobs report flipped the market's read on the Federal Reserve from "rate cuts are coming" to "rate hikes are back on the table." Yields surged, and the priciest corner of the market, the AI and semiconductor trade, took the hardest hit. A weak Broadcom result the day before had already started the chip slide.
Two facts shape what follows. The drop came from record highs, after the Nasdaq climbed about 25% across April and May, its best two-month run in more than twenty years. And strong employment is not the stuff recessions are made of. This was a rate scare, not an economic one. That distinction drives the rest of this note.
Big down days travel in packs
Single-day Nasdaq drops of 4% or more are rare. List every one and they bunch into a handful of crisis windows.
| Period | Notable single-day Nasdaq drops |
|---|---|
| 1987 (Black Monday) | -11.4%, -9.0%, -9.0% |
| 2000-2002 (dot-com bust) | -9.7%, -7.6%, -7.1%, -7.2% |
| 2008 (financial crisis) | -9.1%, -8.5%, -9.0% |
| 2011 (debt-ceiling, euro crisis) | -6.9% |
| 2020 (COVID crash) | -7.3%, -9.4%, -12.3% (the record) |
| 2025 (tariff shock) | -6.0%, -5.8% |
Large moves cluster. A 4% day rarely arrives alone, and the most reliable forecast after one is more big sessions, up and down, over the days and weeks that follow. A clean, one-and-done resolution is the exception.
What usually follows
The numbers cut against your gut. After the market's worst single sessions, forward returns have been strong, often above average, because you buy after the fall rather than before it.
- The S&P 500 fell 6% or more in a single day on 14 occasions since 1987. It traded higher a week later in 12 of them and higher three months later in 9 (about 86% and 64%). The sample is small and the drop steeper than Friday's.
- After weekly losses of 5% or more, twelve-month returns came out positive about three times in four.
- After the eight US drawdowns deeper than 20% since 1950, the market averaged about +51% a year later and +82% over three years.
Friday's 4% drop is milder than every threshold in those studies. On the base rates, one bad day points to higher prices months later more often than to ruin.
One figure deserves a trader's attention. J.P. Morgan Asset Management found that seven of the stock market's ten best days over the past twenty years landed within two weeks of its ten worst. The best and worst sessions sit side by side. An investor who put $10,000 into the S&P 500 in 2005 and held through 2024 finished with about $71,750. Miss only the ten best days and the same money finished near $32,871. Selling into fear is how you miss them.
When buying the dip was a disaster
If every dip paid off, this would be an easy call. The record includes years of pain.
The dot-com bust is the warning. The Nasdaq peaked at 5,048 on 10 March 2000, bottomed near 1,140 on 4 October 2002, a fall of about 78%, and did not reclaim that high until April 2015. Buy the early-2000 dip and you waited fifteen years to break even.
2008 ran the same way. The S&P 500 lost more than half its value, and the frightening sessions that autumn marked the middle of the decline, not the end. Each bad day brought more bad days.
Dip or trap: three questions
Line up the dips that bounced fast against the ones that turned into multi-year bears, and three questions sort them.
- Is the economy breaking? Recessions drove the dot-com and 2008 collapses. The quick recoveries (COVID in 2020, late 2018, the 2011 and 2015 scares) happened around economies that kept growing or healed fast.
- Do valuations sit at bubble extremes? A pullback in a fairly priced market stays shallow. A pullback in a market priced for perfection has room to fall before buyers step in.
- Is there credit or liquidity stress underneath? Long bear markets usually carry a financial-system problem, not only nervous sentiment.
Mostly "no" has meant buy the fear. Several "yes" has meant respect it.
Two recoveries show the bright case. In 2020, the market fell 34% in about a month and set new highs within five months, the fastest major recovery on record. In late 2018, a near 20% drop into Christmas Eve healed in about four months.
Where Friday fits
Run the three questions on this selloff and the answer splits down the middle, which helps more than a flat "all clear" or "head for the exits."
For the bulls: strong jobs caused the drop, not a cracking economy, and no credit event is in sight. A rate-driven fall in a growing economy ranks among the more survivable kinds. Some strategists shrugged Friday off as a healthy shakeout of an overheated trade.
Against them: the market fell from record highs after a 25% two-month surge packed into a few AI and chip names at rich valuations. Commentators are drawing dot-com parallels, and the valuation question is the one you cannot wave away. A market priced for perfection does not need a recession to drop. It needs the story to wobble.
On balance, this looks more like a valuation and positioning reset than the opening act of a recession bear market. The benign trigger and healthy economy favor the buyers. The stretched, concentrated, record-high starting point is the real risk. Neither side supports an all-or-nothing bet.
What to do with it
For a long-term investor, the math is blunt. The biggest risk you control after a 4% day is selling into it, banking the loss, and missing the rebound sessions that sit right beside the drops. One red day does not justify changing a multi-year plan. Scary stretches have been sound moments to add long-term money, in tranches rather than all at once.
For a swing trader, the near-term reality matters more.
- Expect a wider range. Big days cluster, so size for more volatility than last month's calm allowed.
- Set your risk before you act. A 4% index day means individual names swing much more, and stops that felt safe in a quiet tape get hit.
- Let the bounce prove itself. Capitulation often gives a sharp rally, then a retest of the low. Whether that retest holds is your signal. Wait for it before you trust the recovery.
- Watch both directions. The same tape that gaps down can gap up on one dovish headline, so chasing a short into an oversold bounce carries its own risk.
Bottom line
A single 4% Nasdaq day has more often opened a buying window than started a catastrophe, and panic-selling into one ranks among the costliest moves an investor makes. Context sets the size of what follows, and this drop carries a live tension: a benign, rate-driven trigger and a healthy economy on one side, a stretched, AI-heavy, record-high market drawing dot-com comparisons on the other.
The likeliest path is neither a crash nor an all-clear. Expect more volatility while traders settle on which story to believe. Plan for the swings, hold your risk in check, and keep one red day from making a ten-year decision.
About the numbers
The "12 of 14 higher a week later" figure covers the times the S&P 500 fell 6% or more in a single day since 1987, a small sample and a steeper drop than Friday's, so treat it as a reference point rather than a 4%-day forecast. The best-and-worst-days data comes from J.P. Morgan Asset Management (past twenty years). The dot-com figures track the Nasdaq Composite from its March 2000 peak to its October 2002 low, back to even in April 2015. Reporting on the 5 June session and the bubble debate: Investopedia, Reuters, Forbes, BBC, Financial Post, CNBC. Forward-return studies: investing.com, ICFS, AllianceBernstein. The 2020 recovery timing: Morningstar, Visual Capitalist. The list of largest Nasdaq daily moves: Wikipedia. Educational only, not financial advice.