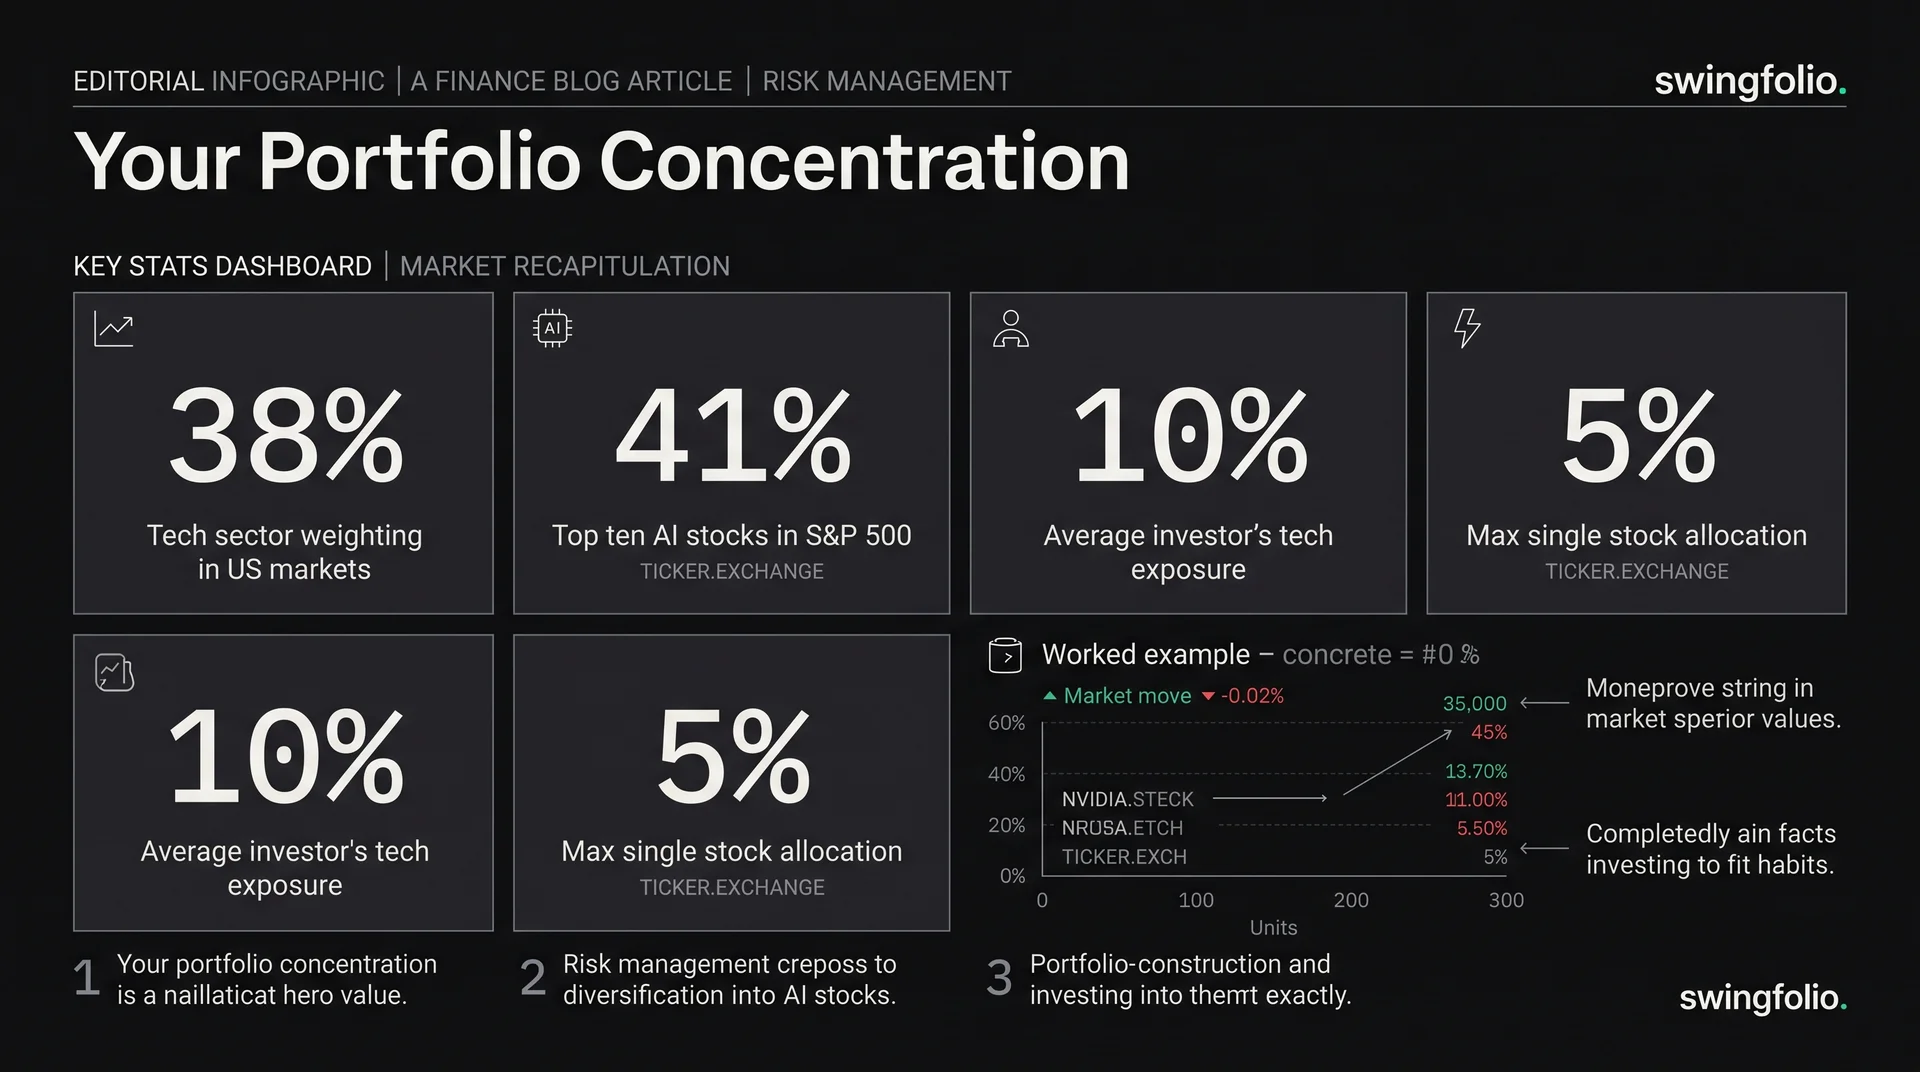
You can own Nvidia directly, through a broad index fund and again through a Nasdaq ETF. Three holdings appear on the statement. One company can drive all three.
Portfolio concentration is the share of your money or planned risk tied to the same company, sector, theme or market factor. Count tickers and you can miss it. Look through the holdings and the overlap becomes measurable.
Direct exposure is the easy part
Start with each direct holding as a percentage of the total portfolio:
Direct weight = holding value / portfolio value x 100
If a $100,000 portfolio holds $10,000 of Nvidia, direct exposure is 10%. That number is visible and auditable.
Sector aggregation is also direct when each stock or fund already has a reliable sector label. Add all holding values assigned to Information Technology, Financials or another sector, then divide by portfolio value.
Sector labels do not capture every shared driver. Alphabet and Meta sit in Communication Services, while Amazon sits in Consumer Discretionary. They may still belong to the same big-tech or AI theme you are trying to measure.
Fund overlap needs look-through weights
An ETF is one line in your portfolio but many securities underneath. To estimate company exposure through a fund:
Look-through exposure = fund weight in portfolio x security weight inside fund
Use holdings published by the fund provider for a stated date. Fund weights change, so save the date and source with the calculation.
Do not assume an ETF's name reveals every holding. A broad-market fund can still have a large allocation to its biggest companies.
Illustrative Nvidia look-through table
This hypothetical $100,000 portfolio uses invented fund weights to show the arithmetic. It does not describe the current holdings of any named ETF.
| Portfolio holding | Portfolio value | Portfolio weight | Illustrative Nvidia weight inside holding | Nvidia look-through exposure |
|---|---|---|---|---|
| Broad US index ETF | $50,000 | 50% | 7% | 3.5% |
| Nasdaq-focused ETF | $20,000 | 20% | 9% | 1.8% |
| Nvidia direct shares | $10,000 | 10% | 100% | 10.0% |
| Other holdings and cash | $20,000 | 20% | 0% | 0% |
| Total | $100,000 | 100% | 15.3% |
The statement shows a 10% direct Nvidia position. Look-through exposure is 15.3% under these illustrative assumptions:
(50% x 7%) + (20% x 9%) + 10% = 15.3%
Replace the invented 7% and 9% with dated provider holdings before using this method on a real portfolio.
Sector concentration and theme concentration differ
Sector concentration answers how much capital sits in official industry groups. Theme concentration answers how much depends on a shared story or economic driver.
Examples of themes that can cross sectors include:
- artificial intelligence spending
- interest rates
- housing activity
- commodity prices
- consumer demand
- one country or currency
A portfolio can pass a sector test and fail a theme test. A chipmaker, cloud platform and data-centre utility sit in different industries but may all depend on the same AI capital-spending cycle.
Write the theme definition before assigning holdings. If you change it after a loss, the calculation becomes hindsight.
Open trades can be one risk in several charts
Four semiconductor swing trades are not independent because they have four tickers. A sector warning can hit every stop together.
Add planned stop risk across correlated positions:
| Trade | Planned stop risk | Shared theme |
|---|---|---|
| Chip stock A | $250 | Semiconductors |
| Chip stock B | $200 | Semiconductors |
| Equipment stock C | $180 | Semiconductor capital spending |
| Software stock D | $170 | AI infrastructure |
| Combined | $800 | Related technology demand |
Correlation does not change the $800 arithmetic. It increases the chance that several planned losses arrive together. Gaps can make realised loss larger than the stop estimate.
A ten-minute concentration audit
- Export every direct holding and fund position.
- Calculate each position's portfolio weight.
- Obtain dated holdings for material ETFs or managed funds.
- Multiply fund weights by underlying security weights.
- Add direct and look-through exposure by company.
- Aggregate the portfolio by sector.
- Define important cross-sector themes and total them separately.
- Repeat the calculation using planned stop risk for open trades.
- Decide which concentration requires a cap, smaller position or no change.
The result is a decision input, not an automatic sell signal. A concentrated portfolio may be deliberate. The important part is knowing the size and the conditions under which you will reduce it.
Do not compare your full portfolio with a survivor
A single Nvidia screenshot can make concentration look like skill without showing the other positions or the drawdown risk. The survivorship bias guide explains why one posted winner is not a representative account.
For the wider difference between diversification, correlation and portfolio construction, read diversification for traders.
What Swingfolio shows and what still needs look-through work
Swingfolio can aggregate recorded positions by sector and show concentration across the instruments in the portfolio. It does not silently decompose every ETF into current underlying holdings.
For fund look-through, use dated provider weights and keep the calculation in your review notes. That preserves the useful distinction between actual portfolio sector aggregation and an illustrative or externally sourced ETF decomposition.
Start the 30-day trial to review direct sector concentration beside your open positions and risk in Swingfolio.
General information only. Not financial advice. Trading involves significant risk of loss. Past performance is not indicative of future results. Always do your own research and consider seeking advice from a licensed financial advisor.