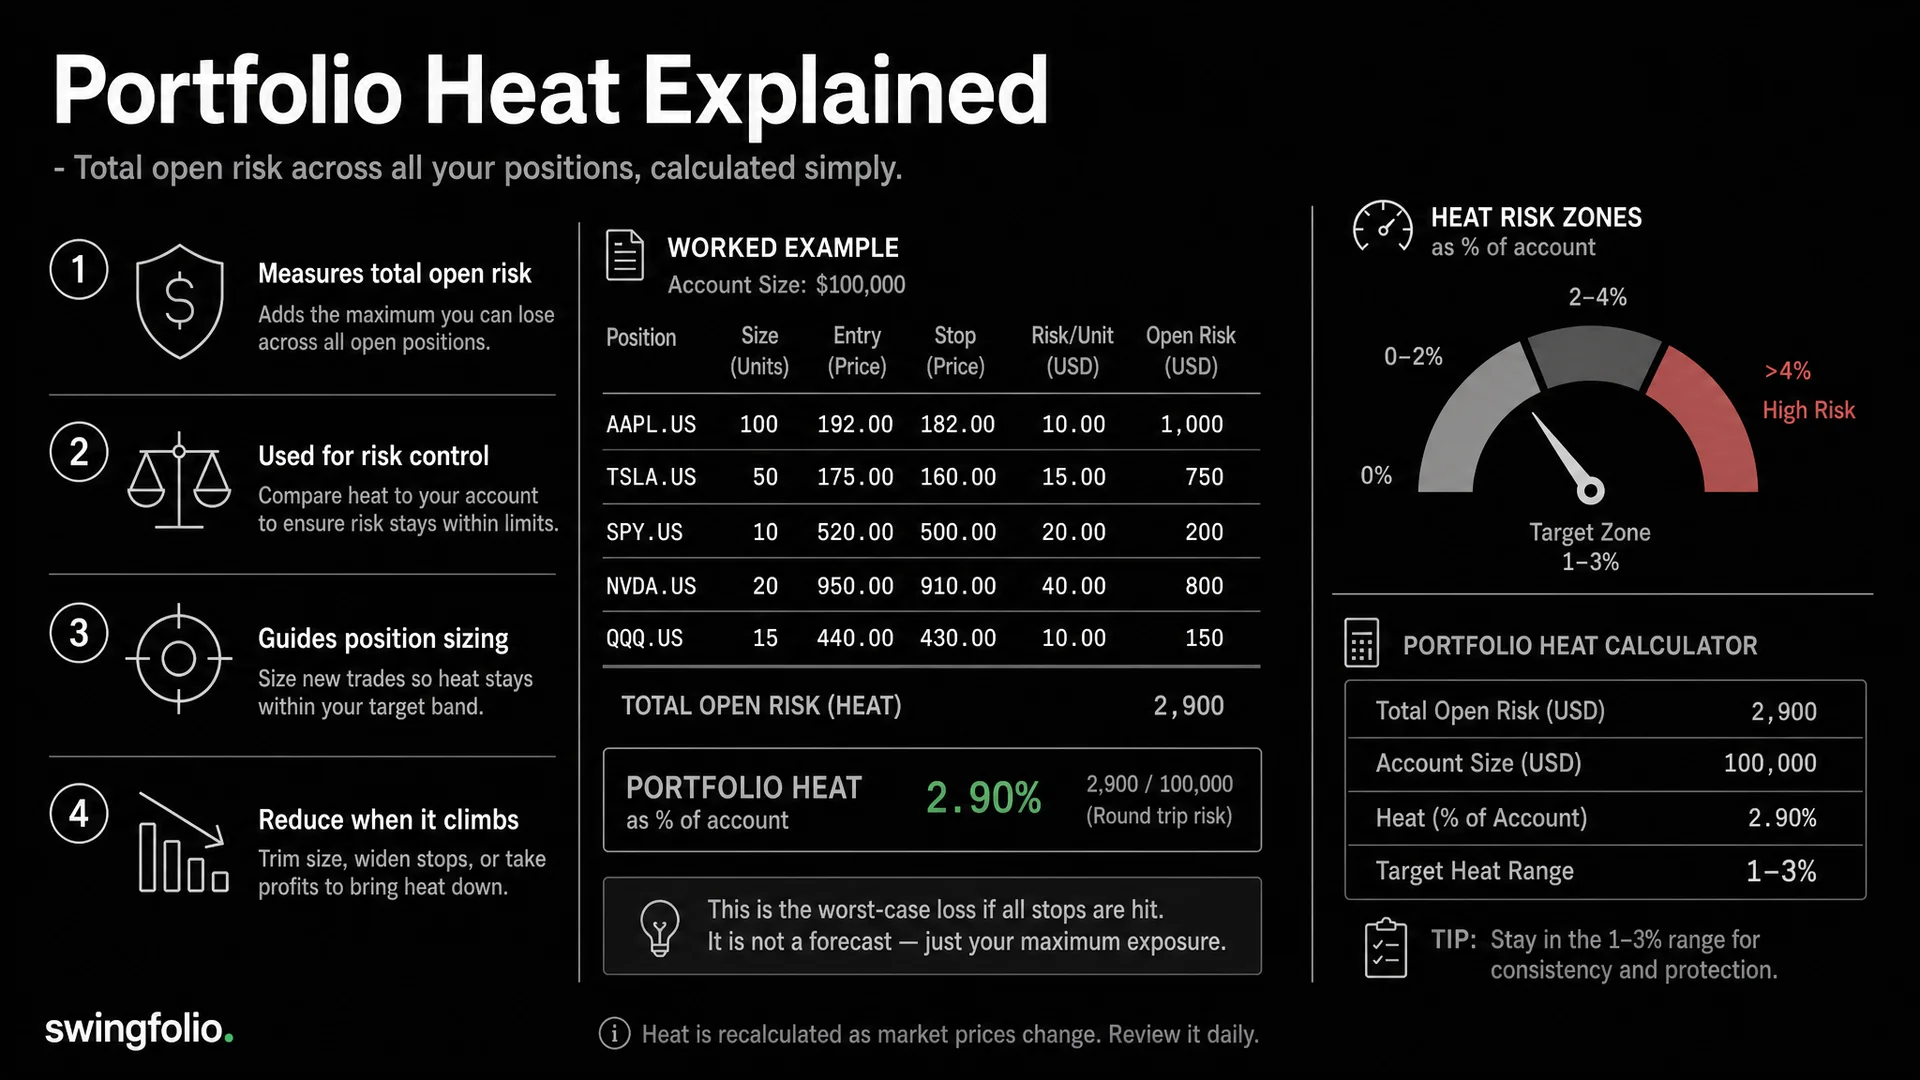
Portfolio heat is the percentage of account equity at risk between your entries and protective stops across all open positions. It answers a practical question: if every position reaches its stop, what loss have you planned for?
That figure complements position sizing. The position size calculator helps size one trade; the portfolio heat calculator adds the planned risk from several positions.
Portfolio heat formula
For each long position:
Position risk = (entry price - stop price) x shares
Then:
Portfolio heat = total planned open risk / current account equity x 100
For short positions, use stop minus entry. The distance should be positive. If a stop has been moved above a long entry, decide how your process treats locked-in gains rather than subtracting them from the risk of unrelated trades.
Complete multi-position example
Assume a $50,000 account holds three hypothetical trades. The tickers are fictional.
| Position | Entry | Stop | Shares | Planned risk |
|---|---|---|---|---|
| ALFA.AU | $25.00 | $24.00 | 300 | $300 |
| BETA.AU | $40.00 | $38.50 | 200 | $300 |
| COVE.AU | $12.00 | $11.40 | 500 | $300 |
Total planned risk is $900. Portfolio heat is $900 / $50,000 x 100 = 1.8%.
Now consider a fourth fictional setup, DUSK.AU, with a $30 entry, $28.80 stop and 250 shares. Its planned risk is $1.20 x 250 = $300. Adding it lifts total risk to $1,200 and heat to 2.4%.
The decision is not simply whether 2.4% sounds low. Ask whether the new trade fits your written maximum, whether several positions share the same catalyst, and whether the stops could fill worse than planned.
Use the free portfolio heat calculator
Enter your account size, then add each position's symbol, entry price, stop loss and number of shares. The calculator shows position value, risk amount, risk percentage, total position value, total risk amount, total heat and average risk per position.
It uses the absolute distance between entry and stop. Review direction and stop placement yourself, especially for short positions. Its safe, caution and danger labels are broad visual guides. Your own limit should reflect your strategy, account, holding period and tolerance for gaps.
What portfolio heat does not capture
Heat is planned stop risk. Real loss can differ.
Gaps and slippage
A stop is an instruction to exit after a trigger, not a guaranteed fill price. Earnings, market shocks or thin trading can create a fill beyond the stop. Treat the heat number as a baseline exposure, then consider event risk separately.
Correlation
Three mining trades may react to the same commodity move. Their arithmetic heat is still the sum of their stop risks, but the chance of simultaneous losses may be higher than it is for unrelated setups.
Review exposure by sector, market, currency and shared catalyst. Diversifying ticker names does not necessarily diversify risk.
Changing equity and stops
Heat changes when account equity, position size or stop levels change. A calculation made on Monday can be stale after a partial exit, new deposit or adjusted stop. Recalculate from the latest plan.
Positions without stops
Without a defined exit level, the simple formula cannot state planned stop risk. Do not enter zero and conclude that the position adds no heat. Define the risk or assess the position with another method.
How to set your own heat limit
There is no universal safe percentage. Start from the loss your account and process can withstand, then work backwards.
Consider:
- typical number of simultaneous positions
- average and worst slippage in your records
- overnight and announcement exposure
- concentration by sector or market theme
- recent drawdown and whether your rules reduce size during it
- whether several strategies fail in the same market conditions
For example, if your maximum planned heat is 4% and current positions use 3.4%, a new trade risking 1% does not fit at full size. You could reduce its quantity, wait for existing risk to come off or reject it. Do not tighten a technically valid stop just to squeeze the number under the limit.
Review heat before every new trade
Use this short routine:
- Update account equity and all open quantities.
- Confirm each stop still reflects the actual plan.
- Calculate current dollar risk and heat.
- Add the proposed trade as a what-if scenario.
- Group positions with common sectors or catalysts.
- Check scheduled announcements and overnight gap exposure.
- Record why the resulting heat is acceptable.
Link the decision to your trading journal template. A brief note such as "heat rises from 2.8% to 3.6%; two positions share bank exposure" is far more useful later than a number with no context.
Ways to reduce portfolio heat
- Skip the new trade. Waiting preserves capacity for a better setup.
- Use a smaller position. Recalculate quantity from the remaining risk allowance.
- Reduce or close an existing position. Base the choice on its current thesis and rules.
- Raise a stop only when the strategy allows it. A tighter arbitrary stop may increase the chance of an avoidable exit.
- Reduce concentrated exposure. Several correlated trades can fail together.
Portfolio heat questions
Is portfolio heat the same as capital invested?
No. Capital invested is the market value of positions. Heat measures the planned loss to their stops as a percentage of equity. A large position with a nearby stop can show less planned heat than a smaller position with a wide stop.
Does moving a stop to entry remove all risk?
It reduces the formula's planned price risk to zero. Gap risk, slippage and costs remain, so describe the result as zero planned stop risk rather than a guaranteed break-even exit.
Should pending orders count?
They are not open-position heat before filling, but they can become exposure quickly. Include them in a what-if calculation before placing several orders that may trigger together.
Swingfolio puts open-position risk beside the rest of your trade workflow, making it easier to review exposure as plans change. Start the 30-day trial and make the heat check part of every entry decision.