What Risk-Reward Ratio Actually Means
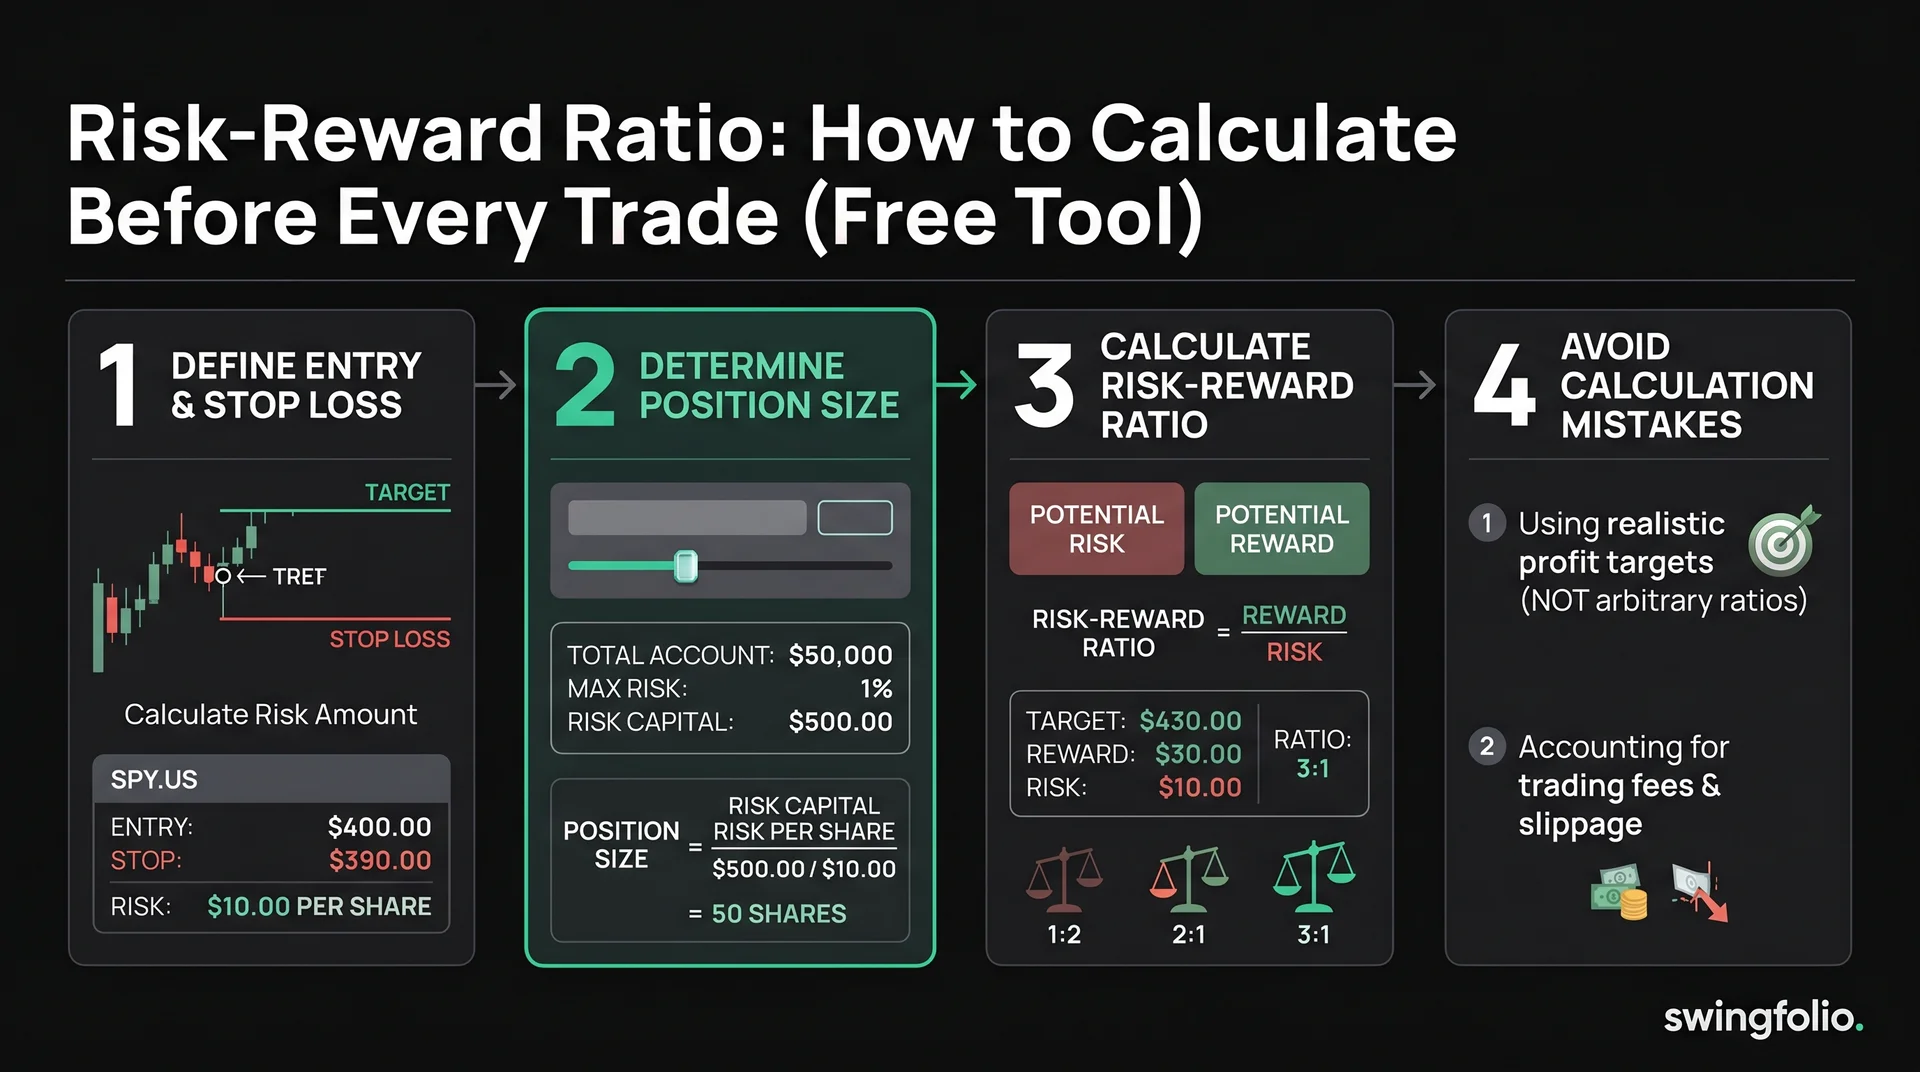
The risk-reward ratio compares how much you stand to lose on a trade against how much you stand to gain. It is calculated before you enter the trade, using your planned entry price, stop loss, and target price.
The formula:
Risk-Reward Ratio = (Target Price - Entry Price) / (Entry Price - Stop Loss)
That gives you the ratio for a long trade. For a short trade, flip the numerator and denominator logic:
Risk-Reward Ratio = (Entry Price - Target Price) / (Stop Loss - Entry Price)
A ratio of 2:1 means you expect to make twice what you are risking. A ratio of 3:1 means three times. The first number is always the reward, the second is the risk.
A Worked Example
You are looking at BHP.AU trading at $45.00. Your analysis suggests a move to $49.50 is likely, and you would place a stop loss at $43.50 if you entered now.
- Entry price: $45.00
- Target price: $49.50
- Stop loss: $43.50
Reward = $49.50 - $45.00 = $4.50
Risk = $45.00 - $43.50 = $1.50
Risk-Reward Ratio = $4.50 / $1.50 = 3:1
For every $1 risked, you are targeting $3 of profit. Whether the trade is worth taking depends on the probability of reaching that target, which brings us to why ratios alone are not enough.
Why 2:1 Is Common Guidance
You will see "never take a trade below 2:1 risk-reward" repeated in trading education. The logic behind it is sound: if you need a 2:1 ratio and your win rate is 40%, you are still profitable.
The maths: 40% wins at 2R each = 0.80R average gain. 60% losses at -1R each = -0.60R average loss. Net expectancy = +0.20R per trade. Over hundreds of trades, that positive expectancy compounds.
A 2:1 minimum gives you margin for error. You can be wrong more often than you are right and still come out ahead. This is why it has become standard guidance.
When Other Ratios Make Sense
The 2:1 rule is a starting point, not a law.
1.5:1 can work when your win rate is high. Some mean-reversion setups on the ASX have win rates above 60%. At 60% wins, a 1.5:1 ratio still produces positive expectancy: (0.60 x 1.5R) - (0.40 x 1R) = 0.90 - 0.40 = +0.50R per trade. That is better than many 2:1 systems with lower win rates.
3:1 or higher is worth targeting on momentum breakouts. When a stock breaks out of a consolidation pattern, the move can be large relative to the risk defined by the breakout level. These setups naturally offer wider reward relative to a tight stop.
Below 1:1 should almost never be taken. A trade where you risk more than you can reasonably gain needs an extraordinarily high win rate to be profitable -- above 70% sustained. Very few retail swing traders achieve that consistently.
The point is that risk-reward ratio and win rate work together. Neither metric alone tells you if a trade or system is worth pursuing.
Calculating Before Every Trade
The risk-reward ratio should be one of the first things you assess before committing capital. Here is a practical checklist:
- Identify your entry price. This might be the current price, or it might be a limit order at a specific level.
- Set your stop loss. Based on your analysis -- below a support level, below the breakout candle, or a fixed percentage. This is the maximum you are willing to lose.
- Set your target. Based on the next resistance level, a measured move, or a fixed multiple of your risk.
- Calculate the ratio. Target distance divided by stop distance.
- Decide. Does the ratio meet your minimum threshold for this type of setup?
If the ratio does not meet your threshold, either the target is too close or the stop is too far. Sometimes you can adjust -- tighter stop, wider target -- but do not force a trade by moving levels to artificial positions just to hit a ratio number.
Use our free risk-reward ratio calculator to run these numbers quickly before placing a trade.
Common Mistakes
Measuring from the current price, not the entry price. If a stock is at $10.00 and you plan to buy at $10.50 on a breakout, your risk-reward ratio should use $10.50 as the entry, not $10.00. The distance from the current price to your entry is not profit -- it is the condition for the trade to trigger.
Ignoring fees in the calculation. For Australian traders paying $10-$30 in brokerage per trade, fees can materially affect the ratio on smaller position sizes. A $3 brokerage on a $500 position is 0.6% each way -- 1.2% total -- which eats directly into your reward.
Setting targets at round numbers without technical basis. A target of "$50 because it's a nice round number" is not the same as a target of "$50 because it's the next significant resistance level on the weekly chart." Targets should have a technical or fundamental rationale.
Using the ratio to justify poor setups. A 5:1 ratio on a trade with a 10% probability of reaching target is a bad trade. The ratio describes potential outcome, not probability. You need both a reasonable ratio and a reasonable probability.
Not adjusting for position sizing. The ratio tells you reward per unit of risk, but it does not tell you how much of your portfolio to risk. A 3:1 trade where you risk 10% of your account is a very different proposition from a 3:1 trade where you risk 1%. Position sizing is a separate and equally important calculation.
Risk-Reward in Practice
Experienced swing traders tend to develop a feel for appropriate ratios over time, but the calculation should still be explicit -- especially when you are building your process.
Keep a record of every trade's planned risk-reward ratio alongside the actual outcome. Over time, you will see patterns: setups where the ratio is consistently achieved, and setups where it rarely is. That data tells you which types of trades are actually worth taking.
SwingFolio calculates the risk-reward ratio for every trade where you enter a stop loss and target price. The analytics section then shows you how your planned ratios compare to your actual outcomes across your full trade history.