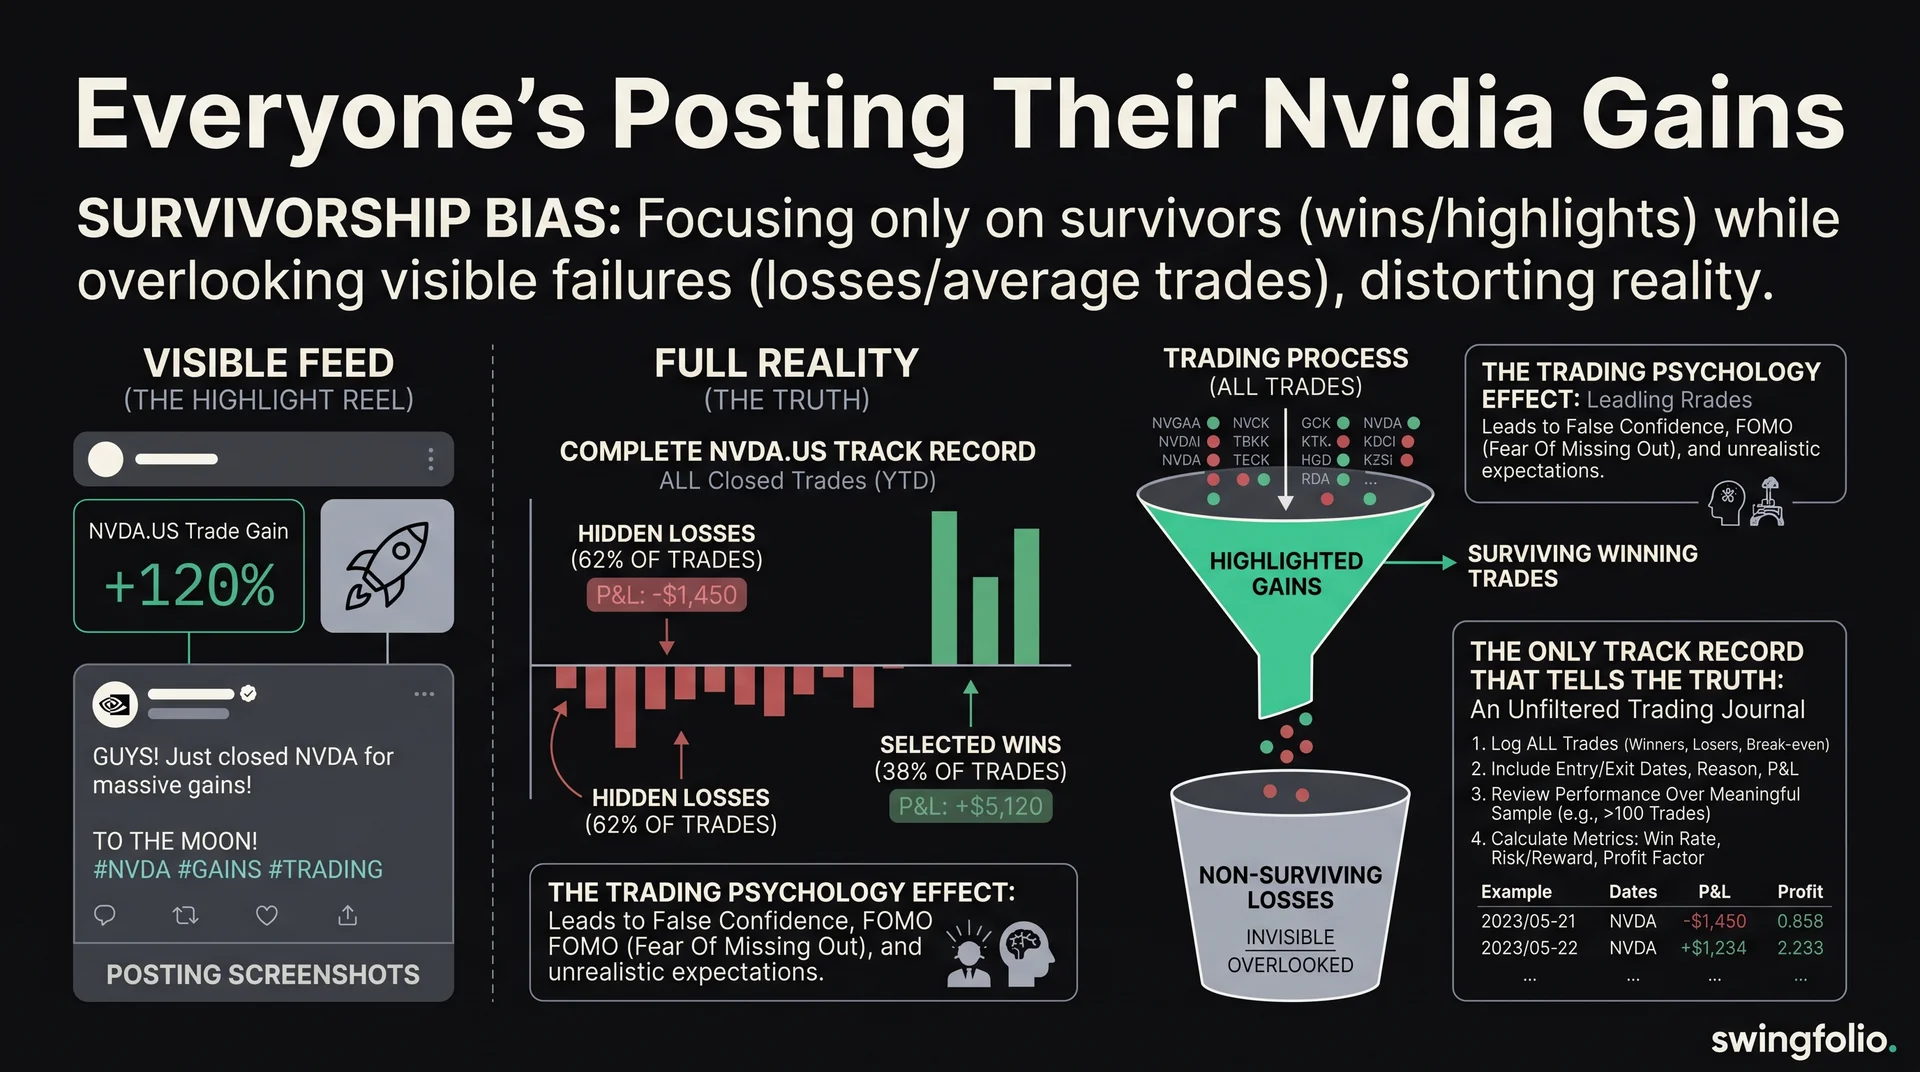
The Nvidia gain in your feed may be real. It can also be a terrible sample.
Survivorship bias appears when visible winners are treated as representative while quiet losers disappear from the comparison. Trading screenshots make this easy: one open position, one favourable date and no view of the rest of the account.
What survivorship bias looks like in trading
Imagine 100 traders each buying a fast-moving stock. A few enter early, hold through the volatility and post large gains. Others enter late, sell too soon, size badly or lose money. The winning screenshots spread because they are interesting. The ordinary and losing results rarely travel as far.
Your feed is not a random sample of all 100 traders. It is a gallery selected by outcome and willingness to post.
The same filter works inside one account. A trader can show Nvidia up 150% while leaving nine flat or losing positions outside the frame. The screenshot proves that one position existed. It does not prove the account, strategy or trader was profitable.
The missing denominator changes the claim
Ask what the posted number is divided by:
- one winning position out of how many total positions?
- one account out of how many failed accounts?
- an unrealised peak gain or a realised result after exit and costs?
- a dollar gain produced by what starting capital and risk?
- a selected month or the full trading history?
Without the denominator, a 200% winner can describe skill, luck, concentration or all three. You cannot tell which from the crop.
Complete-sample comparison
Consider this hypothetical ten-trade record. The R-multiple measures each result against its initial planned risk.
| Trade | Result | Would it make the highlight reel? |
|---|---|---|
| 1 | +4.0R | likely |
| 2 | -1.0R | unlikely |
| 3 | -1.0R | unlikely |
| 4 | +2.0R | possible |
| 5 | -1.0R | unlikely |
| 6 | -0.5R | unlikely |
| 7 | +0.4R | unlikely |
| 8 | -1.0R | unlikely |
| 9 | +0.8R | unlikely |
| 10 | -1.0R | unlikely |
Posting trades 1 and 4 creates a +6R story. The complete record is:
+4 - 1 - 1 + 2 - 1 - 0.5 + 0.4 - 1 + 0.8 - 1 = +1.7R before costs
The strategy remains positive in this illustration, but it is much less spectacular than the selected screenshots. Six of ten trades lost. The +4R outlier carried most of the result.
Now add a second account that stopped posting after five losses. Excluding it from the comparison improves the visible average without any trader improving. That is survivorship bias at the account level.
Open gains are not a track record
An open Nvidia position near a peak answers one question: what was the marked gain at that moment? It does not answer what the trader realised, how much was risked or what happened to the rest of the portfolio.
Useful evidence includes closed results, fees, deposits, withdrawals and drawdown. A fair record also keeps positions that were closed before a rebound and setups that never became screenshots.
This does not mean every posted gain is misleading. It means the claim must stay as narrow as the evidence.
Evidence checklist for a trading claim
Before comparing yourself with a post, ask:
- Is the result realised or still open?
- What dates define the measurement period?
- Are all trades included or only selected examples?
- Are fees, spread and slippage included?
- Were deposits and withdrawals separated from performance?
- What was the largest drawdown?
- How concentrated was the portfolio?
- Is performance measured in dollars, percentage return or R?
- Did the record continue after the posted winner?
Few social posts will answer all nine. That is fine if you treat them as anecdotes rather than benchmarks.
Survivorship bias can trigger the next bad trade
The feed presents someone else's selected winner beside your complete history. That comparison creates the feeling that you missed something obvious.
Use the missed FOMO trade guide to separate a valid missed setup from a rally you discovered after the fact. A screenshot is not a new entry signal.
Concentration can make the posted win look even larger. One oversized Nvidia position may dominate an account in both directions. The portfolio concentration guide shows how direct shares and fund overlap can turn several holdings into one theme.
Build the record the feed leaves out
Keep every closed trade, including the dull ones. Record the plan, size, fees, result and rule adherence. Then review the full distribution rather than the most memorable outcome.
Swingfolio keeps winners and losers in the same history so the screenshot cannot become the sample. The useful comparison is your complete record against your own plan.
Start the 30-day trial to review the full spread of winners, losers and risk in Swingfolio instead of one selected trade.
General information only. Not financial advice. Trading involves significant risk of loss. Past performance is not indicative of future results. Always do your own research and consider seeking advice from a licensed financial advisor.