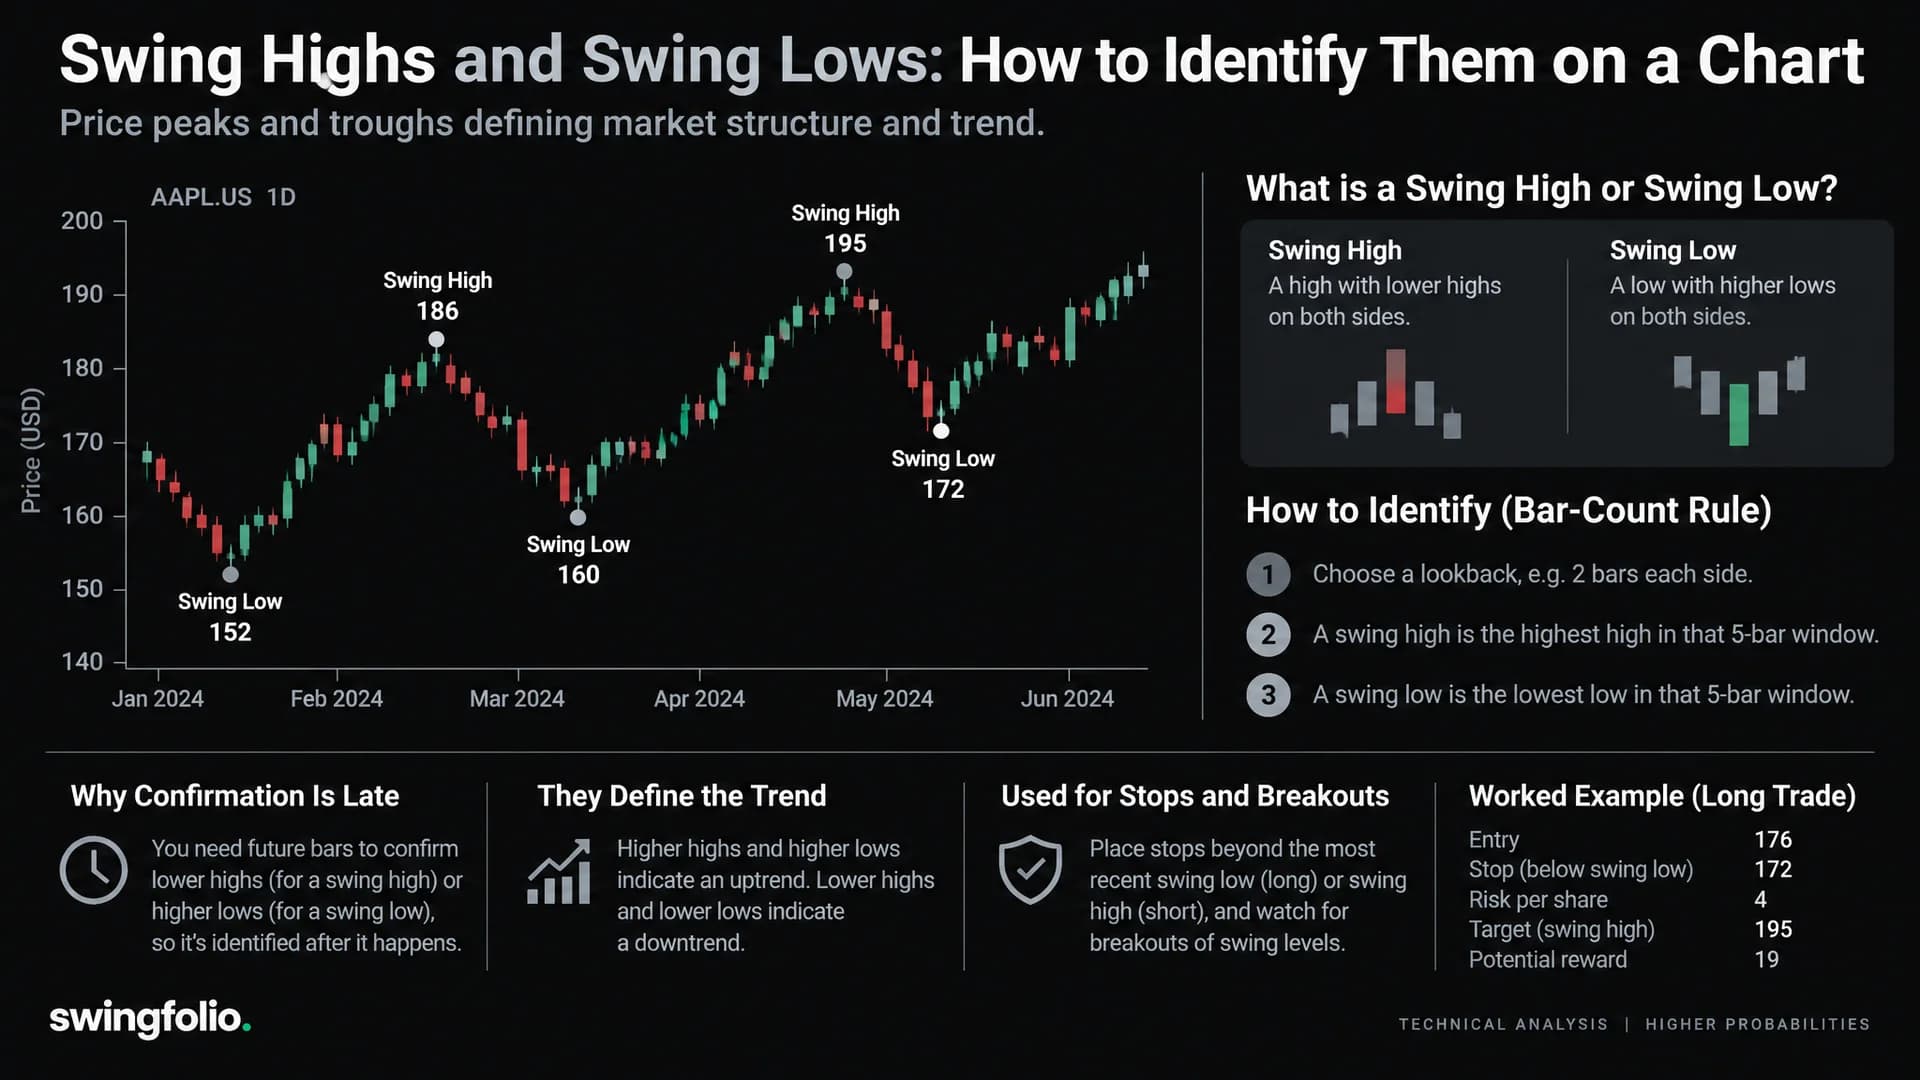
A swing high is a bar whose high is above the highs of the bars on either side of it. A swing low is the reverse: a bar whose low is below the lows of the bars around it. Together they mark the peaks and troughs that define a trend, and they give you reference prices for stops and breakout levels.
This guide covers the bar-count rule for marking swing highs and swing lows, why a swing point is only confirmed after the fact, and a worked example with illustrative prices.
What is a swing high?
A swing high is a local peak on a price chart: a bar with a higher high than a set number of bars before it and after it. The glossary keeps the short version under swing high.
This guide uses two bars on each side. The same shape appears in Bill Williams' fractal indicator, which the MetaTrader 5 documentation describes as a series of at least five bars with the highest high in the middle and two lower highs on both sides.
What is a swing low?
A swing low is a local trough: a bar with a lower low than a set number of bars before it and after it. The glossary entry is under swing low.
Under the two-bar rule, the middle bar of five has the lowest low, and the two bars on each side have higher lows.
How many bars either side?
The bar count is a convention you choose, not a fixed rule. Two bars each side is the version this guide uses; one, three or five bars each side are other choices.
The trade-off follows from the definition:
- A larger count adds conditions. On the same chart, raising the count can only remove swing points or leave the count unchanged. It never adds one.
- A larger right-side count adds delay. With five bars on the right, you learn about a swing point five bars after it forms, not two.
With unchanged price data and the same rule, the qualifying swing points stay the same each time you mark the chart. A bar qualifies only if it passes every comparison.
Two more choices complete the rule:
- Equal prices. This guide uses strict comparisons. For a swing high, any of the four comparison bars with a high equal to or above the candidate's high disqualifies it. For a swing low, any of the four comparison bars with a low equal to or below the candidate's low disqualifies it.
- Wicks or closes. You can measure from the full bar high and low, or from closing prices. This guide uses the full bar.
Why a swing point is confirmed late
A swing high under the two-bar rule is confirmed only when the two bars after it have both closed with lower highs. If either of those two bars reaches or exceeds the candidate's high, the candidate fails. A higher price after the comparison window does not undo a swing high that was already confirmed; it is a new move.
That delay is built into the definition. With two bars on the right, you know about a swing high two bars after it formed.
Charting software has the same lag. TradingView's Pine Script documentation on repainting explains that scripts which detect pivots after five bars often plot the pivot back on the original bar, five bars in the past. A historical chart then shows a pivot that was not visible at the time.
How swing highs and swing lows define a trend
An uptrend is a series of higher highs and higher lows. A downtrend is a series of lower highs and lower lows. StockCharts' Dow Theory article uses these definitions, built from rising or falling peaks and troughs.
Swing points give you the peaks and troughs to compare:
| Latest swing high vs previous | Latest swing low vs previous | Structure |
|---|---|---|
| Higher | Higher | Uptrend |
| Lower | Lower | Downtrend |
| Higher | Lower | Mixed: the two comparisons point in different directions |
| Lower | Higher | Mixed: the two comparisons point in different directions |
For the wider topic of reading direction, see how to read market trends and how to identify trend reversals.
Swing lows as stop references, swing highs as breakout levels
A confirmed swing low gives you a reference price for describing a stop. StockCharts' Dow Theory article treats an uptrend as in place until a lower low forms and the next decline falls below the previous low. A stop placed a set distance below the latest swing low ties the stop to a chart price rather than to a round number. In the example below, the hypothetical stop at $20.80 is $0.10 below the confirmed swing low at $20.90.
A confirmed swing high gives you a reference price for describing a breakout. When price trades through the most recent swing high, it has made a new high relative to that peak. A breakout level set at a swing high is triggered by that event. A bar can exceed a previous swing high before the next swing high is confirmed, as bar 12 in the example below shows.
Two limits apply:
- A stop is an instruction, not a guaranteed price. FINRA notes that a stop order becomes a market order once the stop price is reached, and the price you receive can be markedly different from the stop price. A gap below a swing low can fill well under it.
- A swing price is a single bar's extreme. Price can trade a few cents through it and reverse. A stop set some distance beyond the swing price is a choice you make, and recording that distance lets you compare it across trades.
For more on stop methods, read stop loss strategies. For how swing points relate to wider price zones, see support and resistance levels, and for breakout rules, the resistance breakout strategy.
Worked example: marking swing points bar by bar
The prices below are hypothetical and for illustration only. They show 13 daily bars and use the two-bars-each-side rule on full bar highs and lows, with strict comparisons.
| Bar | High | Low |
|---|---|---|
| 1 | $20.40 | $19.80 |
| 2 | $20.90 | $20.10 |
| 3 | $21.60 | $20.70 |
| 4 | $21.30 | $20.60 |
| 5 | $20.80 | $20.05 |
| 6 | $20.50 | $19.95 |
| 7 | $20.95 | $20.30 |
| 8 | $21.70 | $20.85 |
| 9 | $22.40 | $21.50 |
| 10 | $22.10 | $21.20 |
| 11 | $21.80 | $20.90 |
| 12 | $22.60 | $21.40 |
| 13 | $23.00 | $21.60 |
Bars 1, 2, 12 and 13 cannot be tested in full. Bars 1 and 2 lack two earlier bars on this table, and bars 12 and 13 lack two later bars.
Swing high at bar 3 ($21.60). Bars 1 and 2 have lower highs ($20.40 and $20.90), and so do bars 4 and 5 ($21.30 and $20.80). You can mark it only after bar 5 closes.
Swing low at bar 6 ($19.95). Bars 4 and 5 have higher lows ($20.60 and $20.05), and so do bars 7 and 8 ($20.30 and $20.85). Confirmed after bar 8.
Swing high at bar 9 ($22.40). Bars 7 and 8 have lower highs ($20.95 and $21.70), and so do bars 10 and 11 ($22.10 and $21.80). Confirmed after bar 11. At $22.40 it is above the $21.60 swing high, so it is a higher high.
Swing low at bar 11 ($20.90). Bars 9 and 10 have higher lows ($21.50 and $21.20), and so do bars 12 and 13 ($21.40 and $21.60). Confirmed after bar 13. At $20.90 it is above the $19.95 swing low, so it is a higher low.
The other testable bars fail. Bar 4's high of $21.30 is below bar 3's $21.60, for example, and bar 10's low of $21.20 is above bar 11's $20.90.
After bar 13 closes, the chart shows a higher high and a higher low: an uptrend structure under this rule.
Now look at bar 12. Its high of $22.60 trades through the $22.40 swing high. On bar 12 you could see that break, but you could not yet know that bar 11 was a swing low, because bar 13 had not traded. Anyone reading this chart later sees both points at once. That is the lag in practice.
The stop arithmetic from a confirmed swing low
Take a hypothetical long position opened at $22.80 after bar 13 closes, when the bar 11 swing low is confirmed. The stop sits 10 cents below that swing low, at $20.80, and the planned risk is $500:
- Risk per share: $22.80 - $20.80 = $2.00
- Shares: $500 / $2.00 = 250
- Planned loss at the stop: 250 x $2.00 = $500, before costs and assuming the order fills at $20.80
The position size calculator runs this arithmetic from an entry, a stop, an account value and a risk percentage.
Common mistakes when marking swing highs and lows
Marking every small move
With one bar each side, any bar with a higher high than its two neighbours counts as a swing high, so the list can include small pauses. A larger bar count adds comparisons, and each added comparison can only remove candidates.
Using a swing point before it is confirmed
This is lookahead: treating a pivot as known on a bar where the confirming bars had not traded. In a backtest or a chart review, it produces results that were not available at the time. In the example, bar 11's low price was known on bar 12, but it was not yet a confirmed swing low. Treating it as confirmed on bar 12 uses information from bar 13.
Changing the rule after the fact
Switching from two bars to three because the result looks better on one chart means your trades no longer share one definition. Comparing them afterwards then mixes two rules.
Mixing timeframes
A swing low on a 1-hour chart and a swing low on a daily chart come from different bars, so they can sit at different prices. This guide's example uses daily bars throughout.
For pattern-level structure built from swing points, such as head and shoulders, see chart patterns.
Recording swing-based stops in a trading journal
A journal note for a swing-based stop can include which swing point the stop came from and when that point was confirmed. For the example above, the note would hold:
- the timeframe and bar-count rule: daily, two bars each side
- the swing low price and its bar: $20.90, bar 11
- the bar on which the swing low was confirmed: bar 13
- the distance beyond the swing price and the resulting stop: $0.10, stop at $20.80
- any later stop move, and the new swing low it was based on
In Swingfolio, the stop price goes in the Stop row of the trade form's Risk Management section, and the swing low, rule and distance go in the Notes section. With those details recorded, a review of closed trades can compare stops set from confirmed swing lows with stops set another way. The trading journal template lists the other fields covered before, during and after a trade.
Frequently asked questions
What is the difference between a swing high and resistance?
A swing high is a single peak defined by a bar-count rule. Resistance is a price zone where advances have stalled, often more than once. Several swing highs near the same price can form a resistance zone.
Is a swing high the same as a pivot high?
The terms describe the same shape: a bar with lower highs a set number of bars on each side. TradingView's Pine Script, for example, detects these with a function named ta.pivothigh, and its repainting documentation uses five bars on each side. Platforms can use different bar counts, so their pivots and yours can differ.
How many bars do I need to confirm a swing low?
As many bars as your rule has on the right side. Under the two-bars-each-side rule, a swing low is confirmed when the two bars after it have both closed with higher lows.
Do swing highs and lows work on any timeframe?
The definition applies to any bar size, from minutes to weeks. Different timeframes group prices into different bars, so their swing prices can differ or coincide.
Check the arithmetic on your own figures: the free position size calculator takes an entry, a stop, an account value and a risk percentage.
The prices and trade in this article are hypothetical and for illustration only. General information only. Not financial advice.