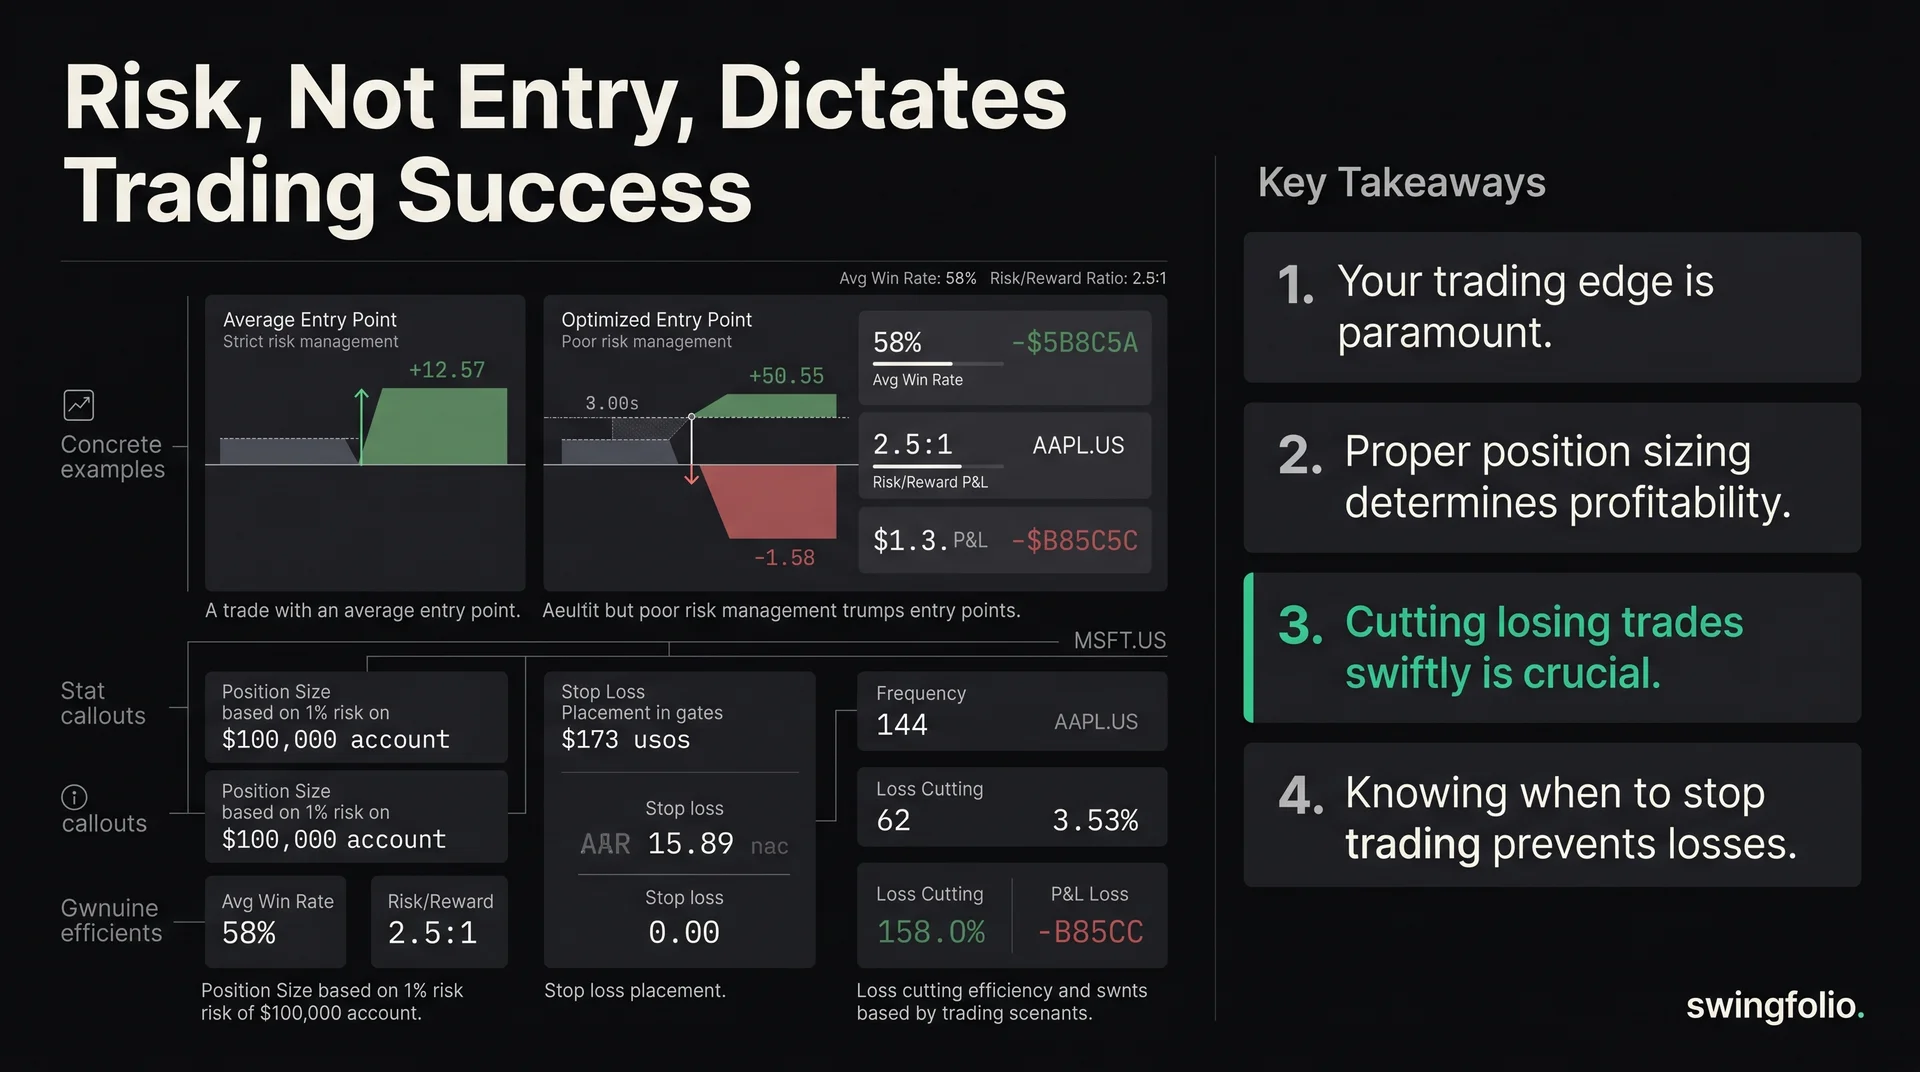
If your trading is not profitable, another entry signal may not be the first fix. Diagnose four parts separately: whether the setup has expectancy, how you size it, what trading costs remove and whether you execute the written rules.
Entries matter because a strategy without an edge cannot be rescued by discipline. Risk management matters because poor sizing or exits can destroy a real edge. You need evidence for both.
Start with expectancy, not a favourite indicator
Expectancy estimates the average result per trade:
Expectancy = (win rate x average win) - (loss rate x average loss)
Measure wins and losses in R, where 1R is the initial planned risk. This makes different prices and position sizes easier to compare.
Assume a setup wins 45% of the time. The average winner is +1.8R and the average loser is -1.0R:
(0.45 x 1.8R) - (0.55 x 1.0R) = +0.26R per trade before costs
That sample has positive entry and exit expectancy before costs. It does not promise the next trade will win or that the live result will match.
A four-part profitability diagnosis
Consider a hypothetical ledger with 40 eligible signals. Had every signal been taken at standard size and exited by the written rules, this sample would have returned +10.4R before costs.
1. Entry and exit expectancy
The trader skips three valid signals after losing trades. Under the written exit rules, those skipped signals later record +2.5R, -1.0R and 0R, a net +1.5R.
The trader executes 37 signals. Their rule-based gross result is +8.9R because +10.4R - 1.5R = +8.9R. Signal selection changed the sample before size, costs or execution are considered.
2. Position size
The plan risks $200, or 1R, on each trade. The trader doubles size on five high-conviction losing trades. Those trades return a combined -3R at normal size but lose the equivalent of -6R at double size.
Variable size adds another -3R compared with the written plan. Conviction changed the dollar outcome without improving the signals.
3. Costs
Brokerage, spread and slippage average 0.08R on each of the 37 executed trades:
37 x 0.08R = 2.96R in costs
The +8.9R gross result on executed signals falls to +5.94R after costs.
4. Execution
The trader moves four stops on trades outside the five oversized trades. Four planned -1R losses become an average -1.6R. That adds 4 x 0.6R = 2.4R of excess loss.
Early exits reduce three other planned winners by a combined 2.0R. The size, stop and early-exit groups do not overlap, so each row below is an incremental change:
| Diagnostic item | Effect versus written plan |
|---|---|
| Three skipped signals, net | -1.5R |
| Trading costs on 37 trades | -2.96R |
| Oversized losing trades | -3.0R |
| Moved stops | -2.4R |
| Early exits | -2.0R |
| Total drag | -11.86R |
The ledger moves from +10.4R under the written rules to -1.46R live. The example is deliberately transparent, not a claim about typical trader results. It shows why a losing account can have more than one cause.
Three habits that protect the diagnosis
1. Size from planned risk
Choose the account amount you can lose if the stop fills as planned. Divide that amount by the entry-to-stop distance to calculate units.
Use the same method on exciting and ordinary setups. A wider stop means fewer units. The result is a maximum unit count under the stated stop assumptions and a planned-risk estimate. It is not the maximum possible loss because a gap can fill beyond the stop.
2. Keep normal losses normal
Set the invalidation point before entry. Do not widen it merely because the loss is uncomfortable.
Let winners follow their exit rule as well. Cutting every green trade early can reduce average win enough to remove positive expectancy.
3. Stop when the process deteriorates
Define a pause rule before the session or week begins. It might trigger after two rule breaches, a daily loss limit or signs that you are taking setups outside the plan.
The pause is not a prediction about the next trade. It prevents a damaged decision process from receiving more capital.
Separate a strategy problem from an execution problem
Use two reviews:
- Compliant trades only: Did trades that followed every rule produce positive expectancy after costs over a meaningful sample?
- All live trades: How much did skipped signals, rule breaches and variable size change that result?
If compliant trades lose after costs, revise or stop the strategy. If compliant trades hold up but the full sample loses, focus on execution before changing the entry.
The rule adherence score gives you a repeatable way to classify those trades. It does not prove the strategy has edge, but it keeps rule-breaking wins from polluting the diagnosis.
Do not turn a missed trade into a new loss
Skipped winners can distort the sample and trigger a chase. Record the valid signal even when you do not enter it, then compare the planned trade with what happened.
The missed FOMO trade guide shows how to log the miss and prevent it from changing the size or entry on the next idea.
Review the largest leak first
Do not repair five things at once. In the example, variable size was the largest behavioural drag, followed by moved stops, early exits and skipped signals. Standardise size first, then measure another fixed sample.
Swingfolio keeps plans, results, fees and review notes together so you can trace the loss to the setup, size, costs or execution instead of blaming whichever indicator failed last.
Start the 30-day trial to diagnose expectancy, costs, size and rule execution from the same trade record in Swingfolio.
General information only. Not financial advice. Trading involves significant risk of loss. Past performance is not indicative of future results. Always do your own research and consider seeking advice from a licensed financial advisor.