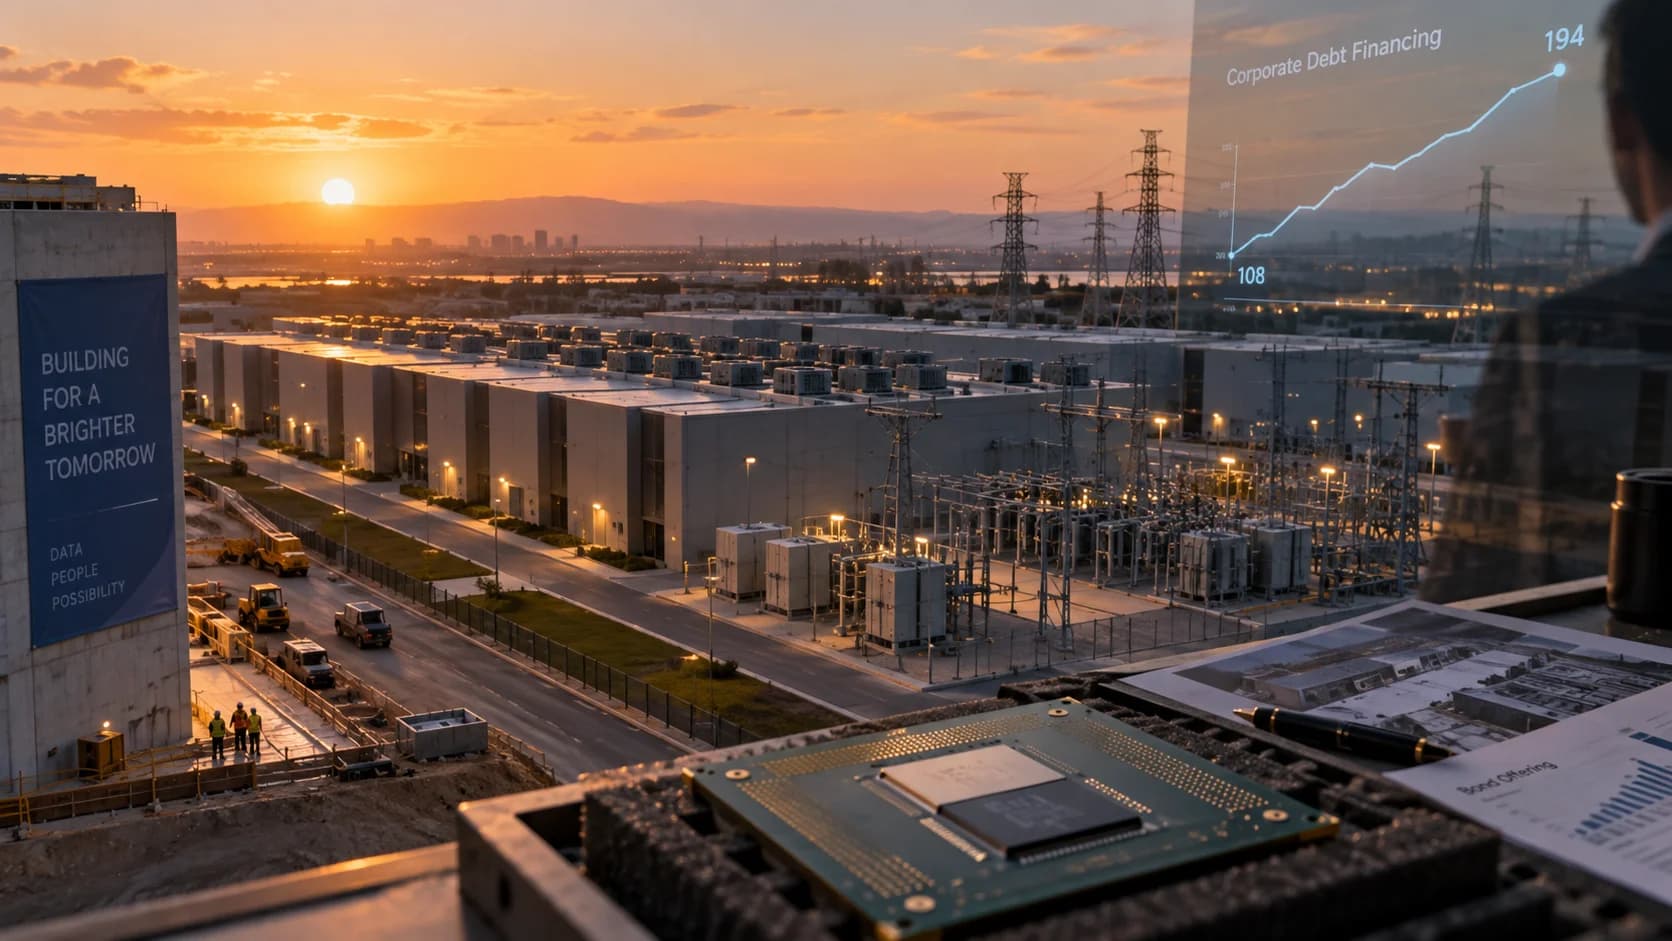
The biggest cloud companies borrowed $108 billion in 2025. According to Goldman Sachs, that was about a quarter of their total capital spending, the money that goes into buildings and equipment. By early August 2026 they had borrowed $194 billion, already more than the whole of the previous year.
That borrowing is happening inside companies, not in your account. It still matters if you hold stocks connected to the AI build-out, because it changes how the spending is paid for. The borrowing figures describe financing. The example below shows how different businesses can share a source of demand.
This post covers what the borrowing figures show, why debt changes the timing of costs and revenue, a worked example with three holdings, and how to look at the theme as one line in Swingfolio.
What the borrowing figures show
In an August 2026 discussion, Goldman Sachs's head of credit strategy research gave these figures for the largest cloud computing companies, often called hyperscalers:
| Period | Debt issued | Debt issued as a percentage of total capital spending |
|---|---|---|
| 2025 | $108 billion | about 27% |
| 2026, to early August | $194 billion | not yet known |
Two cautions apply to these figures:
- The 27% is a share of total capital spending. It is not the share of AI spending alone, although the build-out was the subject of the discussion.
- The 2026 figure is a year-to-date total. It says how much had been borrowed by early August, not how much will be borrowed by the end of the year.
Why borrowing changes the timing
Borrowing adds interest costs to project spending, and those costs can begin before the project generates revenue. That gap is normal for large building projects. The point is not that the borrowing is dangerous. The point is that debt can create interest costs before a project generates revenue, while the businesses supplying the build-out are paid along the way.
Meanwhile, a long list of other businesses sell into that build-out: chip makers, power suppliers, equipment makers and the landlords who rent out data centre space.
Worked example: three holdings, one spending cycle
Suppose your portfolio is worth $50,000 and you hold three positions of $5,000 each. This is a hypothetical example.
| Holding | Amount | How it connects to the build-out |
|---|---|---|
| A chip maker | $5,000 | supplies the chips |
| A power company | $5,000 | supplies the electricity |
| A data centre landlord | $5,000 | rents out the floor space |
| Total | $15,000 | 30% of the portfolio |
Each holding looks like a separate idea, and in many ways it is. The three businesses have different customers, contracts and costs. The chip maker might sell to other buyers. The landlord might have long leases.
They do not have to move in lockstep. But in this example, all three earn part of their revenue from the same build-out. If that spending slows, all three have the same reason to feel it.
So when you add up how much of your portfolio depends on one theme, count those three together: $15,000, or 30% of the portfolio, rather than three unrelated $5,000 positions.
Amount invested is not the same as risk
The 30% in this example is the share of the portfolio invested in the theme. It is not a forecast of a loss, and it is not a claim that the three stocks will fall together. It is a way to see how much of the portfolio rests on one spending cycle, so you can decide whether that is the amount you intended.
For a related view, see portfolio concentration, which covers how a few large holdings can dominate a portfolio.
Looking at the theme in Swingfolio
Swingfolio has a basket for AI data centres and power: a set of about 20 US stocks connected to the build-out, tracked as one line. The basket page shows:
- returns over one day, one week, one month and the year to date
- relative strength against the benchmark index
- a performance chart of the basket against that index
- a breadth panel for the basket's stocks
The basket tracks its own set of stocks, not your holdings. Use it as a reference: check how the theme has moved as a whole, then compare it with how much of your own portfolio is tied to it.
Open the AI data centres and power basket in Swingfolio to compare the theme's performance with the benchmark.
Frequently asked questions
Is the build-out borrowing a warning sign?
Not on its own. Goldman describes the hyperscalers behind these figures as highly rated. The borrowing totals alone do not establish whether their investments will pay off. The useful point for a trader is that many businesses now depend on the same spending cycle.
Does this mean AI stocks move together?
No. Different businesses can move very differently. The example only shows that they share one source of demand, which is a reason to count them together when you measure exposure to a theme.
What counts as the "same theme"?
Any holdings whose revenue depends, in a meaningful part, on the same source of spending. Your own judgment decides where the line sits; the point is to make that judgment deliberately.
Source
Goldman Sachs, "How AI Debt Is Reshaping Credit Markets", Goldman Sachs Exchanges, recorded 3 August and published 5 August 2026: goldmansachs.com.
The portfolio and holdings above are hypothetical. General information only. Not financial advice.