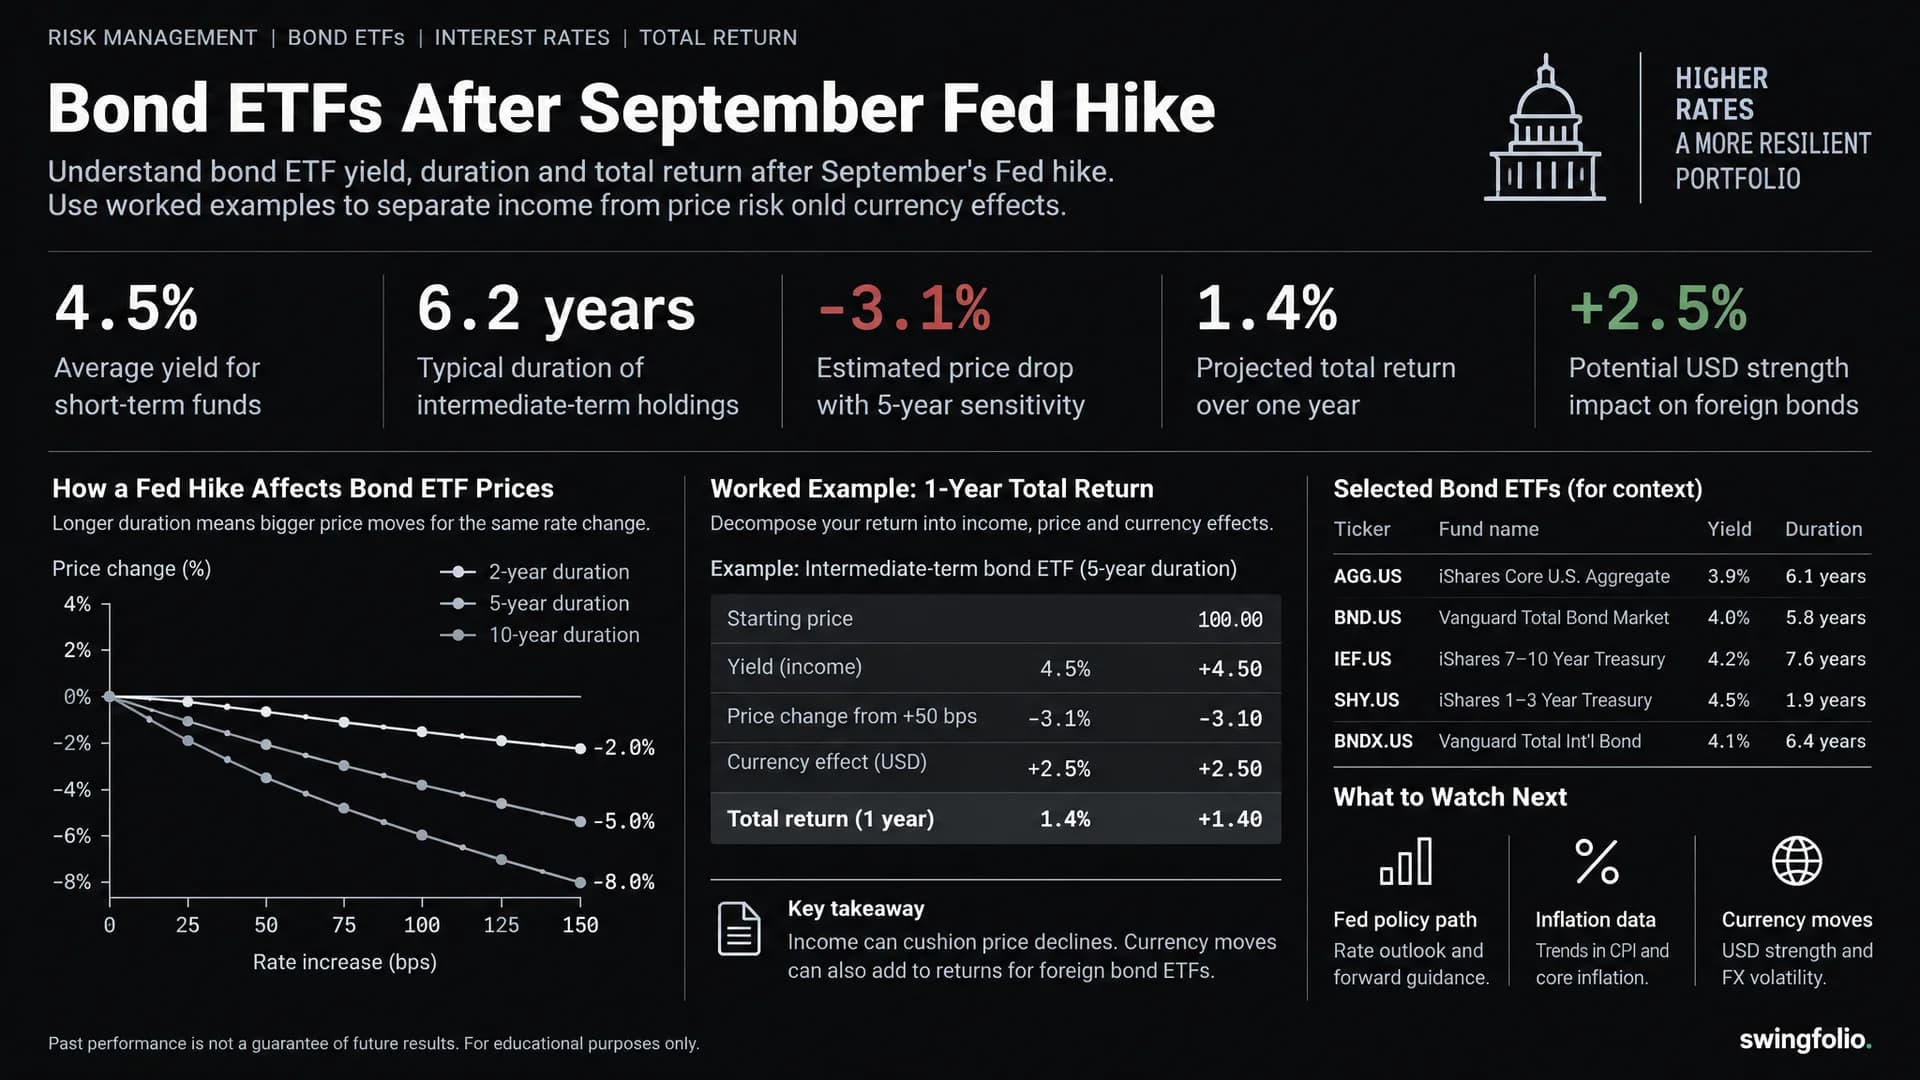
A bond ETF can pay income while its unit price falls. The yield on a factsheet and the total return in your account measure different things. To understand the risk, check the portfolio's sensitivity to market yields, its credit exposure and any currency hedge.
The question is timely after the Federal Reserve's 16 September 2026 decision to raise its target range by 0.25 percentage points to 3.75–4.00%. That policy move does not tell you exactly how a particular bond ETF will perform.
Policy rates and bond yields are different inputs
The Fed sets a target for an overnight rate. Investors price bonds across maturities using expectations about future rates, inflation, growth and other risks.
A rate increase that markets already expected may produce a different reaction from a surprise. Long-term yields can also move differently from short-term yields.
For an Australian bond ETF, inspect its actual holdings. A US policy announcement does not mechanically change every Australian bond yield by the same amount.
Betashares' explanation of duration and the yield curve provides a useful starting point for these distinctions.
What duration tells you
Modified duration approximates how sensitive a bond's price is to a small change in yield. For a portfolio, the reported measure summarises that sensitivity under the fund's methodology.
A first-order approximation is:
Percentage price change ≈ −modified duration × yield change
Use the yield change as a decimal. A 0.50 percentage-point rise is 0.005.
Suppose a hypothetical ETF has a modified duration of 5.5. For a parallel 0.50 percentage-point rise in relevant yields:
−5.5 × 0.005 = −0.0275, or approximately −2.75%.
On a $10,000 position, that is about $275 of price decline before other effects.
This is a sensitivity estimate, not a forecast. Larger moves, a non-parallel yield-curve change, credit-spread changes and convexity can alter the result. “Duration of 5.5” also does not mean the ETF matures in 5.5 years.
Income is only one part of total return
Consider a hypothetical one-year holding:
| Item | Amount |
|---|---|
| Initial investment | $10,000 |
| Cash distributions received | $400 |
| Ending value of units | $9,200 |
| Ending units plus cash received | $9,600 |
| Total return, ignoring reinvestment, fees and tax | −4.0% |
The investor received cash equal to 4% of the initial investment, yet lost 4% overall. Looking only at the distribution would miss the price decline.
For an actual performance comparison, use the fund's stated return methodology and consistent treatment of reinvestment and fees. The benchmark guide explains why definitions matter.
Read the yield label
Different factsheet measures answer different questions:
- Distribution yield: a measure based on distributions, often historical. Check the period and formula.
- Running yield: typically annual coupon income relative to current price, under the stated method.
- Yield to maturity: an estimate based on bond cash flows and price, with assumptions about holding, payment and reinvestment.
None is a guaranteed one-year ETF return. A portfolio can change its holdings, market prices can move, and an investor can sell before the underlying bonds mature.
Do not compare one fund's distribution yield with another's yield to maturity as if they used the same definition.
Check the other risks alongside duration
| Exposure | Why it matters |
|---|---|
| Credit | An issuer's ability to pay and the compensation investors demand can change |
| Currency | An unhedged foreign bond holding adds exchange-rate movements |
| Liquidity | Trading spreads can widen when markets are stressed |
| Portfolio rules | The fund may replace maturing bonds to maintain its target exposure |
| Leverage | A geared product can amplify changes and introduce additional risks |
A floating-rate portfolio may have lower interest-rate duration than a fixed-rate portfolio but still carry credit and liquidity risk. A government-bond label does not remove price risk from a long-duration fund.
Read the current factsheet and product disclosure statement for the instrument you are considering. ASIC's Moneysmart ETF guide explains why the fund's assets and structure matter.
Bond funds and individual maturity dates
An ordinary open-ended bond ETF does not promise to repay your purchase price on a maturity date. It may keep rolling its portfolio under an ongoing mandate.
Some defined-maturity funds have a planned termination date. Even then, the amount returned depends on the portfolio, expenses and terms. Do not treat every product with a year in its name as a guaranteed term deposit.
If your purpose is to fund a known payment, record the date, currency and amount of that obligation before assessing the investment.
A pre-trade note you can review later
Write down the fund's date-stamped duration, yield definition, credit mix, hedge policy and role in your portfolio. Add a scenario for both rising and falling relevant market yields.
For a tactical trade, specify the price or event that would change the plan. For a portfolio allocation, specify when you will review the exposure. Avoid changing the purpose after the market moves.
Your Swingfolio notes can preserve those assumptions alongside the position. Use the risk-sizing guide for the trade plan, while recognising that a stop does not remove gap or liquidity risk.
Common questions
Does a Fed hike guarantee a bond ETF will fall?
No. Prices reflect expectations and the fund's specific exposures. The relevant market yields may already incorporate the decision or move differently.
Will holding longer remove every loss?
No. Income and reinvestment can change the result over time, but credit events, portfolio changes, costs and the sale date still matter.
Is a higher advertised yield always better?
No. Identify the definition and the risks associated with earning it before comparing funds.
Reviewed 27 September 2026. Examples are hypothetical sensitivity and accounting illustrations, not forecasts or personal investment advice.