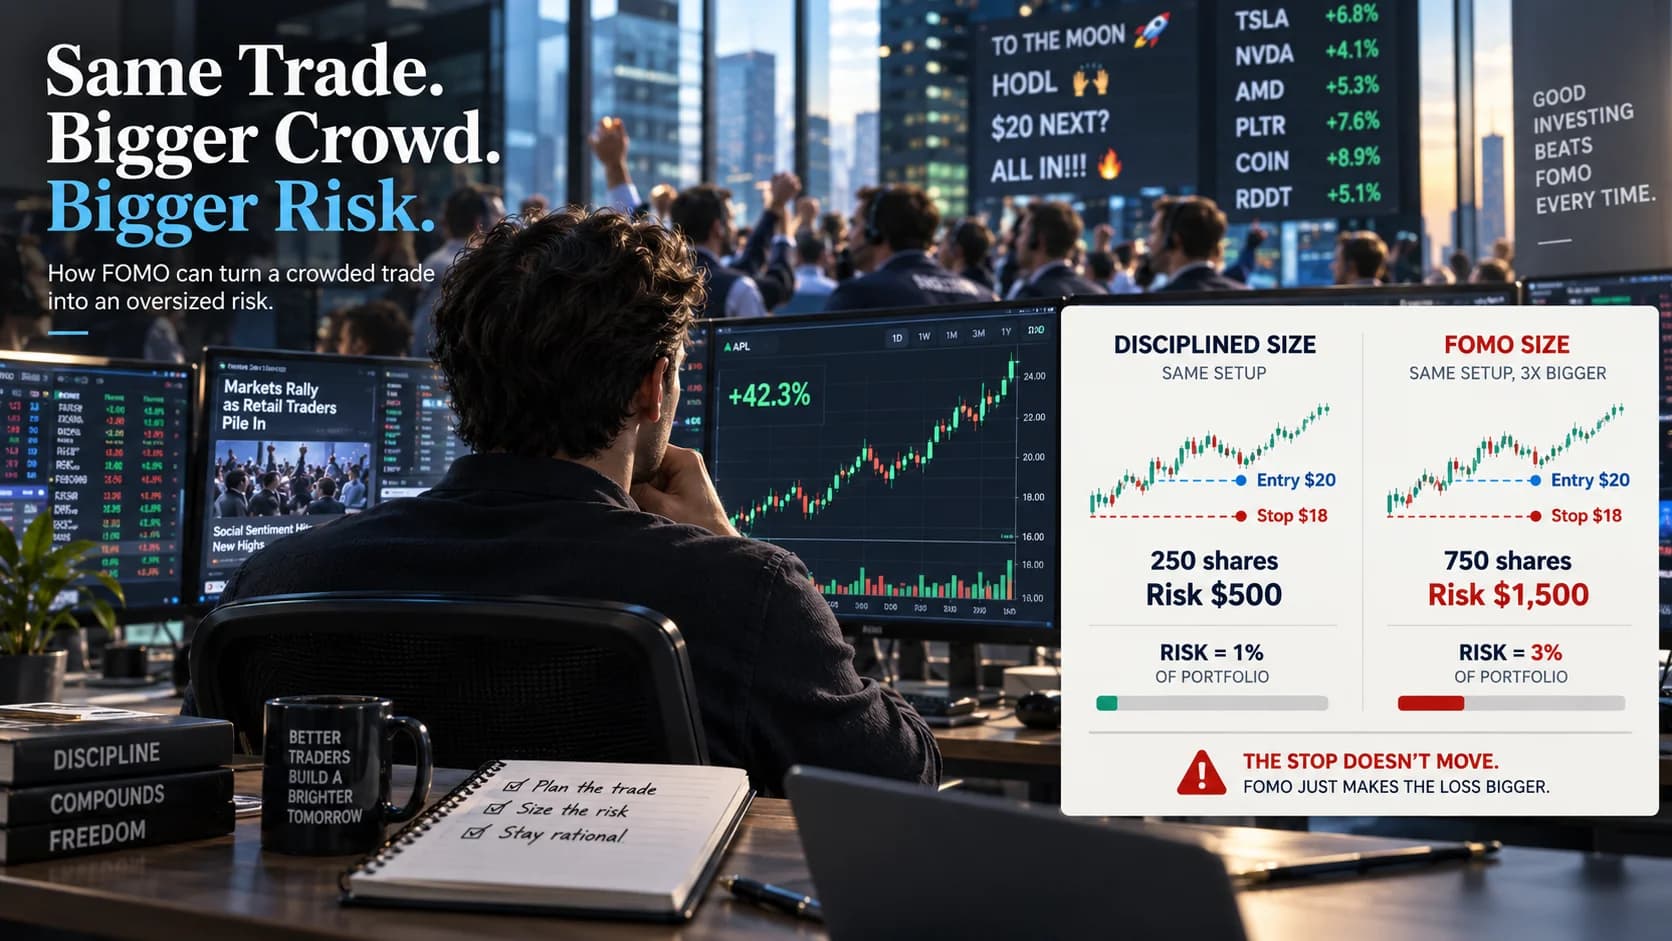
A crowded trade can feel reassuring: the stock is rising, everyone is talking about it, and buying more starts to seem reasonable. But with the same entry price and stop loss, buying three times as many shares means three times the planned loss.
That is how fear of missing out, or FOMO, can change a trade without changing the setup. A position you intended to risk $500 on becomes a $1,500 risk. The stop stays in place; the amount you could lose grows.
Here is how that happens, how to calculate the difference, and what to look for in your trading journal.
What is a crowded trade?
A crowded trade is one in which many market participants hold similar positions or pursue the same idea. In a popular stock, that might mean buyers gathering around the same earnings story, sector theme or breakout.
Popularity does not tell you whether a trade will win or lose. It can, however, affect your own decision. Seeing the same idea repeated can make you feel more confident even when your entry, stop and reasons for taking the trade have not changed.
The useful distinction is between market crowding and your position size. You may not know how crowded a stock really is. You can still know how much you plan to lose if your own trade fails.
How FOMO leads to an oversized position
FOMO trading does not always mean buying a stock you never intended to own. Sometimes it starts with a setup that already fits your strategy:
- You identify an entry and a stop.
- You work out the share count for your usual risk budget.
- More people start talking about the stock, and the price keeps climbing.
- You increase the share count because you do not want to miss a bigger profit.
The decision worth examining is that last one. Has something changed in the trade, or has seeing other people buy made the same trade feel safer?
A winning result can make the extra size feel justified. A losing result exposes its cost. Neither outcome, on its own, tells you whether the original sizing decision followed your plan.
Position sizing example: same stop, three times the planned loss
Suppose your portfolio is worth $50,000. Your usual planned risk per trade is 1%, or $500. This is a hypothetical example, not a recommended risk percentage.
You plan to buy shares at $20 with a stop at $18. The distance from entry to stop is $2 per share. All amounts use the same currency, and the example excludes fees and assumes an exit at the stop price.
| Measure | Usual position | Position increased because of FOMO |
|---|---|---|
| Portfolio value | $50,000 | $50,000 |
| Entry price | $20 | $20 |
| Stop price | $18 | $18 |
| Planned risk per share | $2 | $2 |
| Shares bought | 250 | 750 |
| Amount invested | $5,000 | $15,000 |
| Planned loss at the stop | $500 | $1,500 |
| Planned risk as a share of the portfolio | 1% | 3% |
For a long share position, the calculation is:
Planned loss at the stop = (entry price − stop price) × number of shares
The usual position risks ($20 − $18) × 250 = $500. The larger position risks ($20 − $18) × 750 = $1,500.
The stop has not moved. The risk per share has not changed. You have simply bought three times as many shares, so one loss at the stop would equal three usual $500 losses.
Notice that amount invested and amount at risk are different. Buying $5,000 of shares uses 10% of this portfolio, while the planned loss at the stop is 1%. Confusing those percentages makes it harder to compare trades fairly.
For the broader method, see the position sizing framework for swing traders. The specific issue here is increasing size because an idea becomes popular.
Why a stop loss does not make extra size harmless
A stop price gives the loss calculation a reference point. It does not offset an increase in shares, and it does not guarantee the execution price. As Investor.gov explains, a stop order becomes a market order when triggered, and its fill price can differ from the stop price.
If both example positions instead exit at $17 after a gap, the loss before fees is $750 on 250 shares and $2,250 on 750 shares. That is still three times the loss at the same exit price, but both losses exceed their original plans.
This is why the article uses planned loss, rather than maximum possible loss.
What the AI options headlines can and cannot tell you
The market story behind this example was a burst of activity in AI-related stocks. CNBC's 18 September 2026 report on bullish options activity described more than 1.3 million options traded on one chip maker in the previous session, almost three times its monthly average.
A second CNBC report on 21 September put another AI name's options volume at about 4.5 times its 30-day average.
Those figures describe unusually heavy activity. They do not establish how many traders increased their position size, why they traded, or whether they were all taking the same directional bet. Options can also be part of hedges or multi-leg strategies.
The share example above illustrates a possible response to that excitement. It is not a claim about the behaviour or results of the traders behind those options volumes.
How to spot FOMO sizing in your trading journal
A useful journal review compares the risk you intended to take with the risk you accepted. Profit or loss comes afterwards.
For a trade you were tempted to take bigger, record:
- Your usual risk budget: the dollar amount or portfolio percentage you intended to use.
- The position you took: entry price, share count and stop at entry.
- The reason for any increase: what changed between the first plan and the order.
- The outcome: whether the trade followed your process, as well as whether it made money.
A useful hypothetical note would be:
Usual risk: $500. Bought 750 shares at $20 with an $18 stop, making planned risk $1,500. Increased the size after seeing repeated posts about the stock. Entry and stop were unchanged.
That note makes the decision reviewable. “Strong conviction” alone does not explain why the risk tripled.
Record the original figures while they are available. A later partial exit or stop adjustment changes the remaining risk, so today's percentage may no longer show how large the trade was at entry.
Check whether several trades depend on the same idea
An oversized position is not the only way exposure can grow. Several individually modest trades may depend on the same sector or market theme and lose together.
Portfolio heat adds the planned risk across open positions. It helps put one trade in context, although the total alone does not measure how closely those positions move together.
Review position risk in Swingfolio
In Swingfolio, an open trade with a stop can show Position Risk as a percentage of your portfolio. Compare it with your usual risk per trade, then use the trade's notes to record why you chose that size.
For a long position, the calculation uses the distance from entry price to the current stop, multiplied by the shares still held. If the stop is at or above entry, or the necessary trade or portfolio data is missing, the tile can show a dash.
In the hypothetical example, a newly opened trade would show 3% rather than the usual 1%, assuming those same inputs and portfolio value. That difference identifies a sizing decision to review. Your notes explain whether it came from a deliberate plan or the feeling that everyone else was buying.
Open the trade in Swingfolio, compare its Position Risk with your usual figure, and add the reason for any difference to its notes.
Frequently asked questions
Is a crowded trade always a bad trade?
No. A popular idea can still fit a trading strategy. The concern here is whether popularity changes how much you risk without a corresponding change in your plan. Crowding alone is not a forecast of the next price move.
Does high options volume prove a trade is crowded?
No. It shows activity, but it does not by itself establish common positioning or motivation. It also does not tell you whether an individual trader took more risk than usual.
Is risking 1% the right amount for every trade?
There is no universally suitable percentage. The 1% figure makes the example easy to follow. A risk budget also depends on the strategy, other open positions, liquidity and the losses a trader can absorb.
Can a trade make money and still be oversized?
Yes. If its planned risk exceeded the trader's intended budget, a profitable result does not change that decision. Recording both the process and the outcome helps keep a win from becoming the only justification for taking more risk next time.
The portfolio, share prices, position sizes and outcomes above are hypothetical. General information only. Not financial advice.