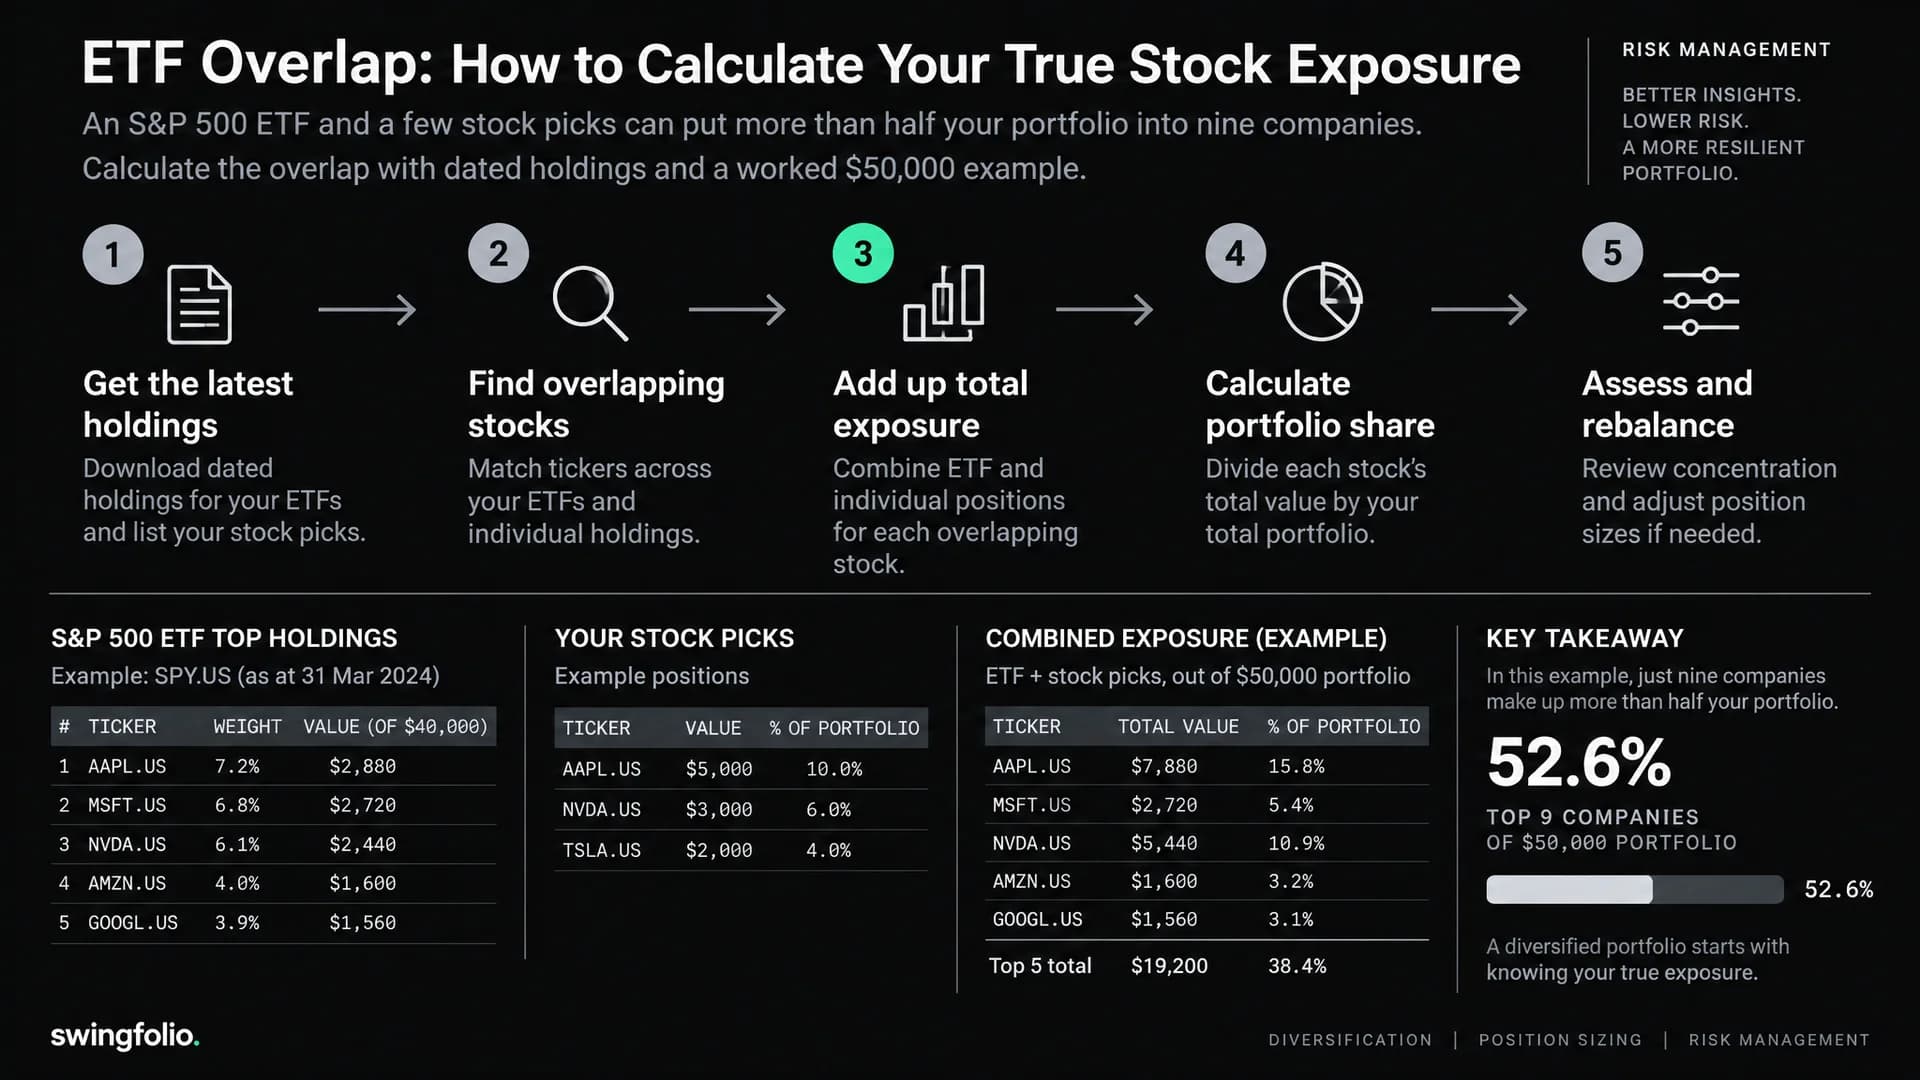
ETF overlap occurs when two or more funds hold the same investments, or when a fund holds shares you also own directly. To measure your exposure to a company, multiply the value of each fund position by that company's weight inside it, then add your direct shares.
That calculation can change how you see a “diversified” account. In the $50,000 example below, three $5,000 stock picks plus an S&P 500 ETF put 53.3% of the portfolio into nine companies. The fund still holds hundreds of other investments. The larger allocations to a few names deserve a closer look.
Why an S&P 500 fund can be diversified and concentrated
The S&P 500 covers 500 large US companies, but it does not give each company an equal share of your money. S&P Dow Jones Indices' methodology uses float-adjusted market capitalisation: the market value of shares available to public investors determines each company's weight.
Larger companies therefore receive larger allocations. A holding's weight can also increase as its price outperforms the others, even if you buy no more units of the fund.
You still gain meaningful diversification by holding a broad fund. One company's failure affects only part of the fund, and you own businesses across industries. The remaining question is how much of your return depends on the largest holdings, especially after you add individual stocks.
For a dated example, State Street's SPY holdings showed these ten largest security positions on 24 September 2026. Combining Alphabet's two share classes gives nine companies:
| Company | Share of SPY |
|---|---|
| Nvidia | 8.19% |
| Apple | 7.38% |
| Microsoft | 5.57% |
| Alphabet, Class A and Class C combined | 5.46% |
| Amazon | 3.69% |
| Meta Platforms | 2.58% |
| Broadcom | 2.51% |
| Micron Technology | 1.84% |
| Tesla | 1.60% |
| Total across these nine companies | 38.82% |
Source: SPY fund holdings, rather than index weights, as of 24 September 2026. The total sums the displayed, rounded weights. Alphabet's 3.03% Class A and 2.43% Class C positions count as one company here. Holdings change.
This is nearly $39 of every $100 invested in SPY. It is the total for ten security positions, not the ten largest distinct companies. Similarly, a fund's reported number of holdings can include separate share classes and cash positions; it is not necessarily a count of companies.
How to calculate ETF overlap in your portfolio
Use the current market value of your holdings, not the amount you originally paid. Convert everything into one currency before adding dollar values, and use fund holdings from the same date where possible.
1. Find each fund's underlying holdings
Open the fund provider's holdings page and download the complete list if available. Record the ticker, company, weight and “as of” date. Match the exact fund and share class you own.
The top-ten list can identify large overlaps, but it cannot establish that the rest of the funds are different. For a complete comparison, you need the complete holdings.
FINRA's concentration-risk guidance recommends checking whether funds hold similar companies or overlap with individual stocks you own.
2. Multiply your fund value by the company's weight
For an ordinary share ETF:
Company exposure through a fund = your fund position's value × company weight in the fund
A $30,000 SPY position at the dated 8.19% Nvidia weight gives:
$30,000 × 0.0819 = $2,457 of indirect Nvidia exposure
This estimates how much of the fund position is attributable to Nvidia. You own units in the ETF; the fund owns the underlying shares.
3. Add direct shares and exposure through other funds
Total company exposure = direct shares + exposure through fund A + exposure through fund B + …
If you also hold $5,000 of Nvidia directly, your total is $7,457. In a $50,000 portfolio, that is:
$7,457 ÷ $50,000 × 100 = 14.91%
Your direct Nvidia position is 10% of the account. Including SPY raises the exposure to about 14.9%. Another fund holding Nvidia would add to it.
4. Group the same company together
Match companies across funds even when names differ slightly. Combine multiple share classes when measuring company exposure, while retaining the original rows so you can check the calculation.
Count each holding once within the group you are measuring. For example, after adding Alphabet's two share classes together, do not add those classes again as separate companies.
These formulas suit unleveraged, long-only equity holdings. Options, short positions, leveraged ETFs and funds that use derivatives need additional exposure calculations.
A $50,000 portfolio: how three stock picks raise concentration
Suppose you hold $30,000 in SPY and four individual positions worth $5,000 each. Three are Nvidia, Apple and Microsoft. The fourth is a company outside the nine-company group above.
The dollar allocations are hypothetical. The fund weights come from the dated State Street snapshot.
| Holding | Position value | Exposure to the nine-company group |
|---|---|---|
| SPY | $30,000 | $11,646 |
| Nvidia shares | $5,000 | $5,000 |
| Apple shares | $5,000 | $5,000 |
| Microsoft shares | $5,000 | $5,000 |
| Company outside the group | $5,000 | $0 |
| Total | $50,000 | $26,646 |
$30,000 × 38.82% + $15,000 = $26,646
$26,646 ÷ $50,000 × 100 = 53.29%
You have put more than half the account into nine companies. The fourth stock may also appear elsewhere in SPY, but it contributes nothing to this particular group's total.
You can now compare that exposure with your intended allocation. You still own nine distinct businesses, but a shock affecting several of them can have a large effect on the account.
For a simple stress test, assume the nine-company group loses 30% and everything else stays unchanged. The estimated loss is $26,646 × 30% = $7,993.80, or about 16% of the portfolio. This scenario is an illustration, not a forecast; losses elsewhere would increase the total.
Our portfolio concentration guide extends the review to sectors, themes and related trading risks.
ETF overlap percentage versus your actual exposure
An overlap checker compares the funds themselves. Your portfolio exposure also depends on how much you invest in each fund and what you hold outside them.
The ETF Research Center's fund-overlap tool distinguishes overlapping holdings by count from overlap by weight. Those measures answer different questions:
| Measure | Question it answers |
|---|---|
| Shared holdings count | How many investments appear in both funds? |
| Overlap by weight | How much of the two funds' allocations is held in common? |
| Your company exposure | How much of your own portfolio depends on this company? |
A common weighted-overlap calculation takes the smaller of the two weights for each shared holding, then adds those smaller weights.
Consider two hypothetical funds:
| Holding | Fund A weight | Fund B weight | Smaller weight |
|---|---|---|---|
| Company X | 60% | 20% | 20% |
| Company Y | 40% | 0% | 0% |
| Company Z | 0% | 80% | 0% |
| Total | 100% | 100% | 20% |
Their weighted overlap is 20%. If you invest $10,000 in each fund, however, your Company X exposure is $6,000 plus $2,000: $8,000, or 40% of your $20,000 portfolio.
Both figures are correct. One describes shared fund allocations; the other describes your money. Check a tool's holdings dates and whether it matches share classes or companies before comparing its results with your own.
Is ETF overlap bad?
Overlap can be deliberate. You might hold a broad-market fund for long-term exposure and add a stock because you want a larger allocation to it.
The problem is an allocation you have not measured. Owning more fund tickers does not, by itself, reduce your exposure to their shared holdings.
Use these questions before adding a position:
- Same benchmark? A second fund tracking the same index will usually add similar market exposure, even if its fees or structure differ.
- Same largest companies? A broad US fund and a growth-focused fund can repeat large positions despite different names.
- Different holdings but shared risks? Two funds can have little company overlap and still respond to the same sector, country or economic conditions.
- A deliberate tilt? Compare the combined exposure with the allocation you intended before buying.
Overlap and correlation differ. Overlap measures shared investments. Correlation describes how returns move together. For the wider portfolio question, see diversification for traders.
How to manage overlap without rebuilding your portfolio
Start with the largest company exposures. Review them against your own allocation limits, time horizon and need for cash.
If an exposure exceeds your intended size, possible responses include directing new contributions elsewhere, reducing a direct holding, or choosing a fund with materially different underlying investments. Compare costs and tax consequences before selling. A lower overlap percentage alone does not make an alternative fund suitable.
An equal-weight fund can reduce the dominance of the largest companies at rebalancing, but it may own the same companies as a market-cap-weighted fund. You change the weights and accept different performance; you do not automatically remove the shared exposure.
For a new swing trade, check both total company exposure and the position size implied by your entry and stop. The amount invested and the planned loss at a stop are different numbers. A gap can also produce a worse exit than planned.
Repeat the overlap check before a material new position and during your regular portfolio review. Save the fund holdings date so you can tell whether a changed result came from your trades or the fund's changing weights.
What you can check in Swingfolio
On a portfolio's detail page, the Allocation Breakdown card lets you review recorded positions By Sector, By Ticker or By Exchange.
Use it to inspect the positions you hold directly. An ETF remains a fund position in that view; Swingfolio does not break it into its underlying company holdings. Calculate that part using the provider's dated holdings and keep the result alongside your portfolio review.
Before adding another stock, write down its current direct exposure, its indirect exposure through funds, and the combined percentage after the proposed purchase. That gives you a figure to compare with your intended allocation.
Frequently asked questions
Does holding two S&P 500 ETFs improve diversification?
If both track the same S&P 500 benchmark, their underlying market exposure will be very similar. You may have reasons to use different funds or providers, but an extra fund ticker does not create a new set of underlying companies.
How much ETF overlap is too much?
There is no universal percentage. Assess the resulting company and sector weights, the role of each fund and your intended allocation. A high overlap can be deliberate; a low overlap can still leave you concentrated in one market or economic risk.
Can I check ETF overlap without a paid tool?
Yes. Download dated holdings from the fund providers, match the securities or companies, and multiply their weights by your fund position values. Add direct shares to calculate company exposure. A spreadsheet is enough for a small portfolio; use full holdings lists if you need a complete result.
Should I count Alphabet's share classes separately?
Count them separately when comparing security-level holdings, but combine them when measuring total exposure to Alphabet as a company. State which method you use. Otherwise, “top ten holdings” and “top ten companies” can appear interchangeable when they are not.
General information only. Not financial advice. Fund holdings change, and the portfolio examples are hypothetical.