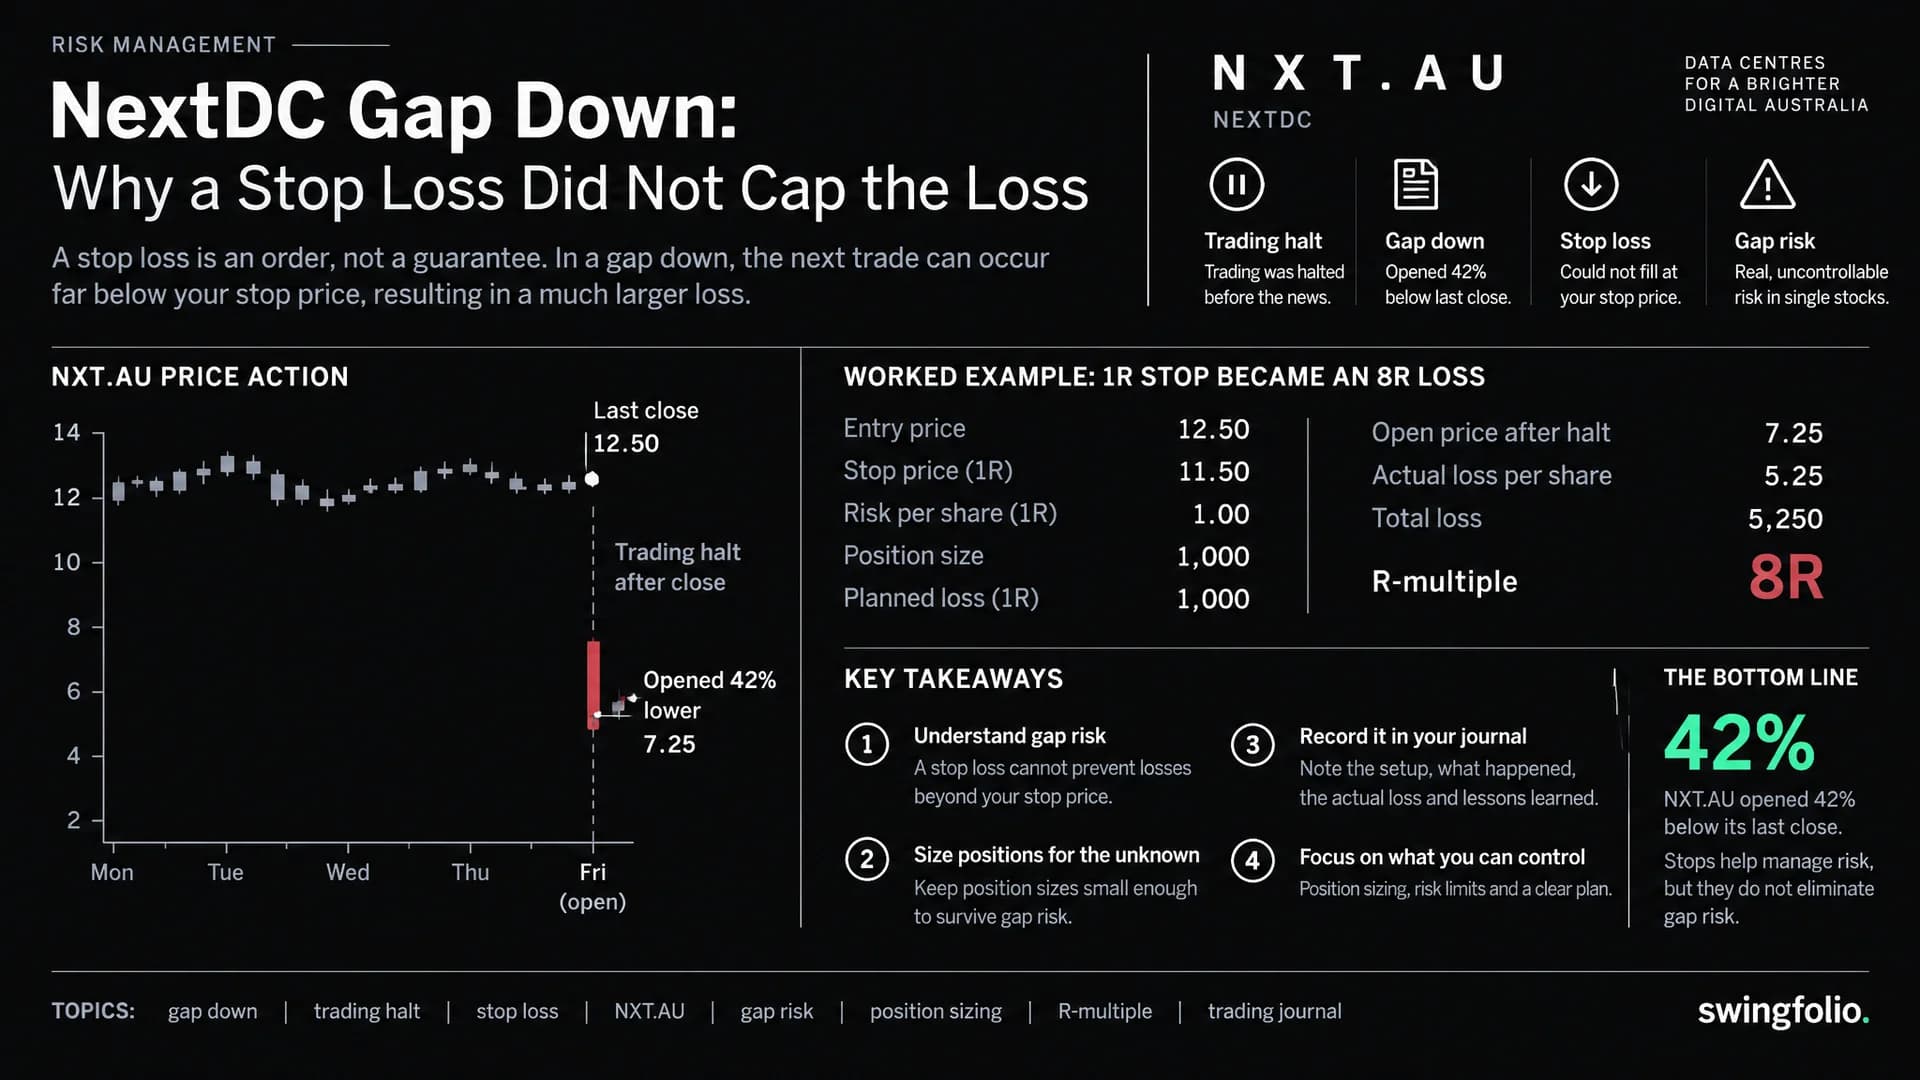
A gap down happens when a stock opens below its previous session's close. When the open is also below the previous session's low, the price skips the whole prior trading range. For a swing trader, that matters because a stop loss inside the gap does not guarantee an exit at its trigger price.
NEXTDC (NXT.AU) showed the effect on 21 October 2026. The shares closed at $9.18 on 16 October, sat in a trading halt for two sessions, then opened at $5.30 on Wednesday. The open was $3.88, or 42%, below the previous close.
What happened to NEXTDC
NEXTDC requested a trading halt on Monday 19 October following a delay to grid power supply at its M3 data centre in Melbourne (The Bull). On 21 October it announced revised FY27 guidance:
| Measure (A$) | Previous FY27 guidance | Revised FY27 guidance |
|---|---|---|
| Net revenue | $615m to $640m | $475m to $500m |
| Underlying EBITDA | $385m to $410m | $245m to $265m |
Source: Market Index, 21 October 2026. These are company guidance figures, not reported results. Market Index reported that the distributor Jemena had suspended the network connection works needed to increase grid supply to M3.
The price data shows the swing trading side of the story:
| Date (2026) | Open (A$) | Low (A$) | Close (A$) | Volume (shares) |
|---|---|---|---|---|
| 15 Oct | 9.30 | 8.78 | 8.86 | 6.07m |
| 16 Oct | 9.15 | 9.00 | 9.18 | 3.36m |
| 21 Oct | 5.30 | 5.07 | 5.35 | 46.3m |
Sources: Swingfolio's EODHD price records for NXT.AU; 21 October close, low and volume from Market Index after the 4:10 pm close. The shares closed 41.7% below the previous close. No trades occurred on 19 and 20 October while the halt was in place. The closing price had already fallen from $13.23 on 1 September to $9.18 on 16 October, a 31% decline.
What happened at SKS Technologies
Another data centre stock had a hard fortnight before the announcement. SKS Technologies (SKS.AU) is an electrical contractor that builds data centre infrastructure; the AFR's Rear Window column described it as NEXTDC's electrician (AFR, 20 October 2026).
| Date (2026) | What happened | SKS.AU close (A$) |
|---|---|---|
| 6 Oct | SKS announced an extra $38 million of work at a Melbourne data centre project | 11.17 |
| 7 Oct | Executive Chair Peter Jinks, Executive Director Greg Jinks and an entity associated with CEO Matthew Jinks sold 10 million shares in an on-market block trade at an average of $10.48 | 9.80 |
| 13 Oct | ASX sent SKS a price query after an intraday fall from $8.605 | 6.89 |
| 20 Oct | The day before NEXTDC's guidance cut | 6.35 |
Sources: SKS director's interest notices and price query response, as reported by The Motley Fool, 16 October 2026; closing prices from Swingfolio's EODHD price records.
Peter and Greg Jinks each sold 4,457,000 shares. Peter Jinks's change of director's interest notice put his consideration at $46,724,513.80 (Kalkine, 8 October 2026), about $93.4 million for the two directors on the same terms. At the $10.48 average, the full 10 million shares come to about $105 million; the AFR put the family's sale at about $100 million. The Motley Fool reported the sale as about 30% of the family's holding, leaving the family with about 21% of the company.
SKS gave its reasons at the time: the sale responded to strong investor demand, aimed to improve the marketability and liquidity of SKS shares, and provided wealth diversification. SKS said the family remained confident in the company's prospects and did not intend further sales for the foreseeable future. In its 13 October price query response, SKS said broader data centre sector announcements may have affected sentiment, and that it knew of no information adversely affecting existing projects or future opportunities.
From the 6 October close to the 20 October close, SKS.AU fell 43.2%. Other data centre stocks also fell over that fortnight after the Firmus IPO did not proceed (Market Index, 14 October 2026).
The timing of the sale and the later price falls does not establish that the Jinks family traded with knowledge of NEXTDC's M3 power delay, or acted improperly. What a trader can see is the disclosure itself: a dated, public event. Whether it matters to a trade depends on what the trade plan says about events like it, written before the news arrives.
A worked example of a gap loss
For example, say a trader entered at the 16 October close of $9.18, with a stop trigger at $8.70 (just under the 15 October low of $8.78), a $50,000 account and a 1% risk budget. Assume the whole position exits at the $5.30 open. All amounts are Australian dollars and exclude brokerage.
- Planned risk per share: $9.18 minus $8.70 = $0.48.
- Risk budget: $50,000 x 1% = $500.
- Position size: $500 / $0.48 = 1,041.67, rounded down to 1,041 shares.
- Position value: 1,041 x $9.18 = $9,556.38.
- Planned risk (1R): 1,041 x $0.48 = $499.68.
- Loss at the open: 1,041 x $3.88 = $4,039.08.
The plan risked 1R. The exit at the open produced -8.08R, a loss of 8.08% of the account. A real order could fill at a different price, since a triggered order does not guarantee any particular price.
You can run the same numbers with the R-multiple calculator.
Why a stop trigger does not fix the exit price
A trading halt, the opening auction and the broker's order rules each play a part.
- A halt stops order matching. ASX does not match buy and sell orders in a halted security. A stop that depends on a new trade cannot trigger until trading resumes.
- The open is an auction. Orders build up during pre-open, then the opening auction matches them at a single price. When news lands during a halt, that price can sit far from the last close.
- A conditional trigger is not a completed trade. ASX has no native stop order type, so retail stops are conditional orders held by the broker. When the trigger condition is met, the broker submits a market or limit order. A market order can fill below the trigger. A sell limit order cannot fill below its limit and may stay unfilled while the price keeps falling.
The rules for each conditional order type depend on your broker, so check its terms. See ASX auctions for how the opening price is set.
What the example shows about gap risk
Position value and planned risk measure different things. The example sized the position at $9,556.38, or 19.11% of the account, because the stop was close to the entry. The 1% risk budget controls the loss at the stop. It does not control the loss in a gap.
For example, with a separate position value limit of 10%, the same trade buys $5,000 / $9.18 = 544 shares, costing $4,993.92. At the same $5.30 exit, the loss is 544 x $3.88 = $2,110.72, or 4.22% of the account.
Known events and unscheduled news are different risks. Earnings dates and AGMs are on the calendar before entry. A guidance update during a halt is not. A trade plan can record which known events fall inside the holding period, and what the trader intends to do about each one.
A halt is a pause, not an outcome. A halt notice gives the reason for the pause. It does not tell you the opening price, or whether an order will fill.
Realised R shows the true cost. If a journal records only planned risk, an 8R loss looks like an ordinary stop. Recording the actual exit keeps the difference visible.
The portfolio heat calculator totals the entry-to-stop risk across open positions; it does not include losses beyond those stops. The position calculator gives share count and position value from your account value, risk percentage, entry and stop.
What to record after a gap loss
A gap-loss journal entry can record:
- The planned risk, stop trigger, order type and any limit price.
- The actual fill and realised R.
- What was known before entry, and what was announced during the trade.
- Director sales or substantial holder changes disclosed in the stock, or in a closely related stock, with the transaction date, disclosure date, source and any stated reasons.
- Position value as a percentage of the account at entry.
- Whether the execution matched the order instructions.
Records kept with the same fields across many trades show how often gaps break the plan, and how much they cost over a year.
For closed trades with an entry, an exit and a stop or stored initial risk, Swingfolio calculates the R-multiple, so a gap loss shows as a -8R trade in your analytics instead of disappearing among ordinary stops.
What is a gap down in stocks?
A gap down is when a stock opens below its previous session's close. If the open is also below the previous session's low, the price has skipped the whole prior trading range. Gaps often follow news released while the market is closed or while the stock is halted.
Does a stop loss protect against a gap down?
A stop loss does not guarantee an exit at its trigger price in a gap down. A triggered market order may fill below the trigger. A triggered sell limit order cannot fill below its limit and may stay unfilled. Execution depends on your broker's rules and the buyers available.
Do director share sales predict a fall?
A director's sale on its own does not show that the price will fall or that the seller expects bad news. Directors sell for diversification, liquidity, tax and personal reasons. Under ASX Listing Rule 3.19A, a listed company must lodge an Appendix 3Y within five business days of a change in a director's interest, so the disclosure can arrive days after the sale. A review of past trades should separate what was public at the time from what became known later.
Can you trade shares during an ASX trading halt?
No. ASX does not match orders in a security while it is halted. Some brokers hold orders for submission when trading resumes, but no trade happens until then.
General information only. Not financial advice. The worked examples use stated assumptions and exclude brokerage.