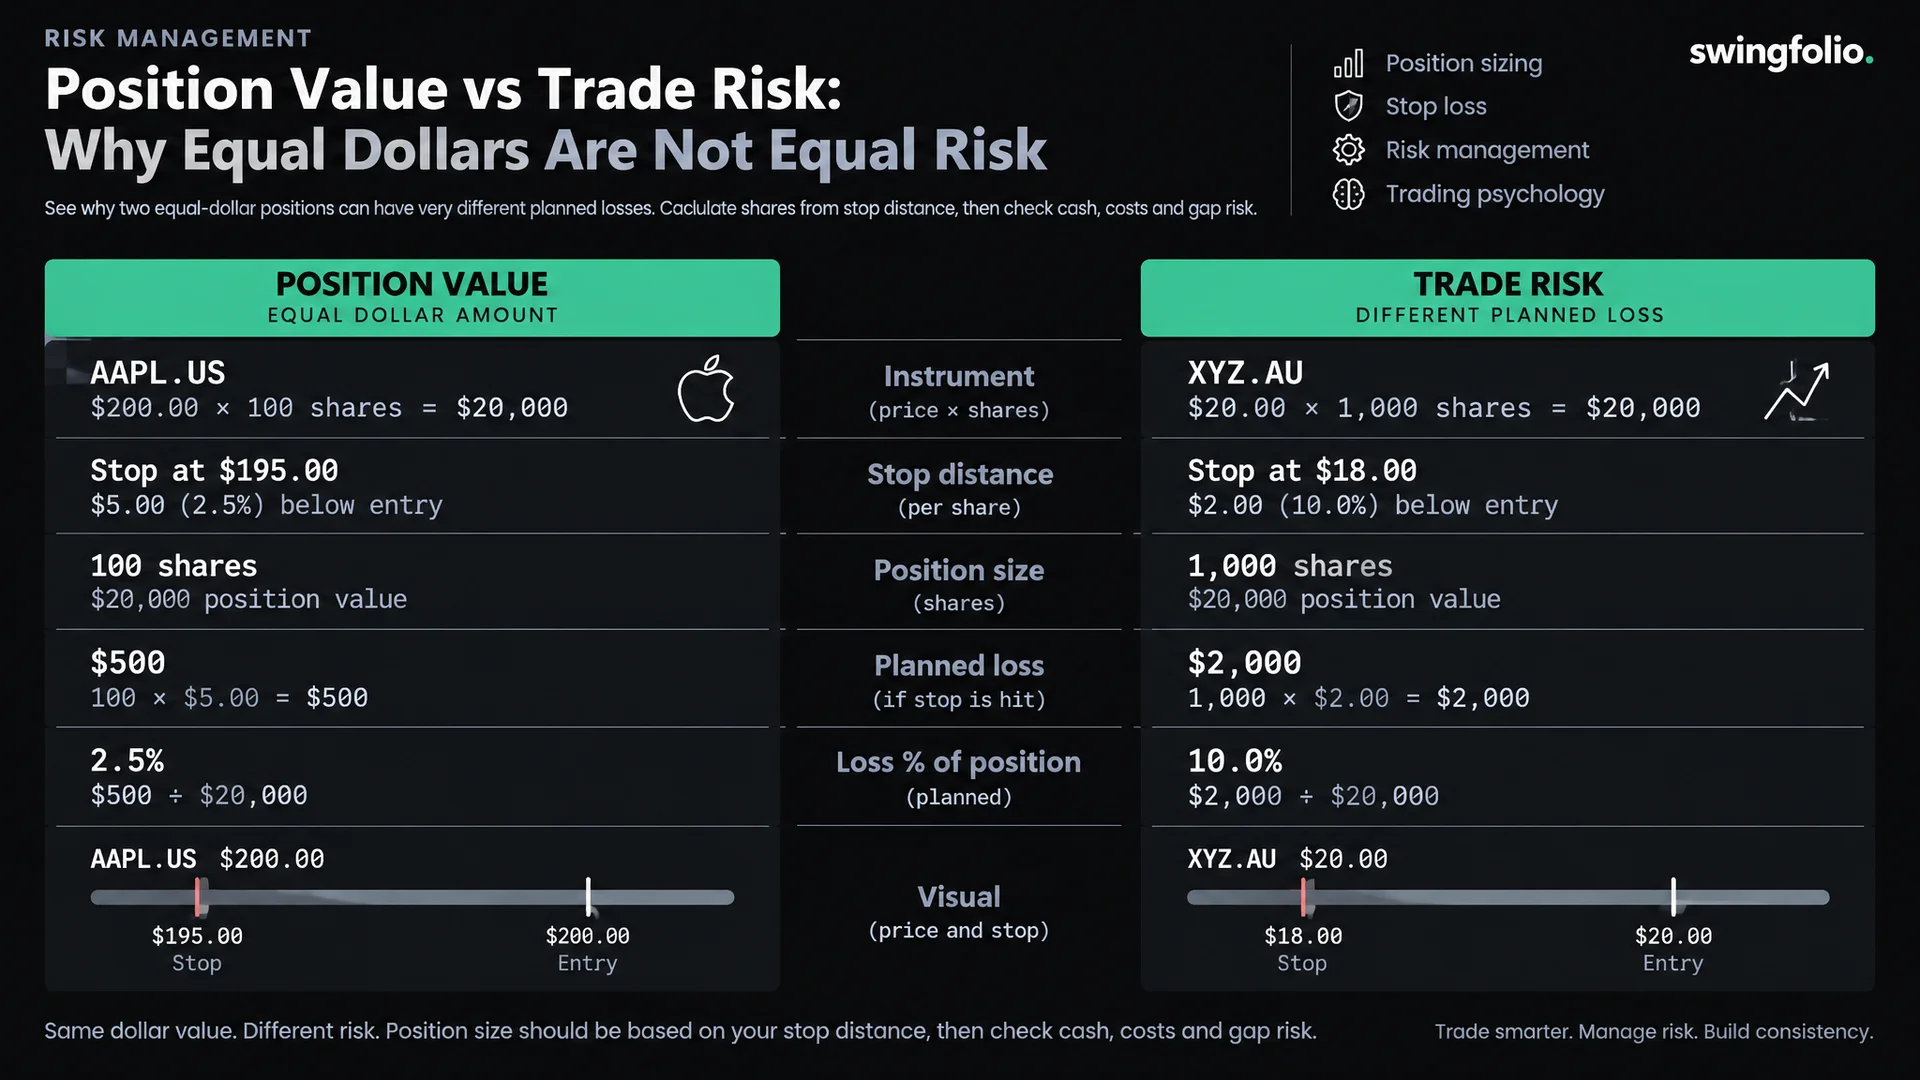
Position value is the amount invested. Planned trade risk is the loss implied by your entry, stop and quantity, before any costs or execution differences not included in the calculation.
Two positions worth $5,000 can therefore have very different planned losses. Check both numbers before entering a trade.
Equal investment, different stop distance
Assume two traders buy 250 shares at $20. Each position costs $5,000 before brokerage.
| Input | Position A | Position B |
|---|---|---|
| Entry price | $20.00 | $20.00 |
| Shares | 250 | 250 |
| Position value | $5,000 | $5,000 |
| Planned stop | $19.60 | $16.00 |
| Distance from entry | $0.40 | $4.00 |
| Planned price loss at stop | $100 | $1,000 |
The second position has ten times the planned price risk. The dollar allocation alone does not show it.
Neither stop is automatically better. The appropriate distance depends on the strategy and market behaviour. A tight stop may be reached more often; a wider stop requires a smaller quantity for the same planned risk.
Work backwards from a defined risk budget
For a simple long share trade:
Shares = planned price-risk budget ÷ (entry price − stop price)
With a $500 budget:
- A $0.40 distance gives 1,250 shares.
- A $4.00 distance gives 125 shares.
At a $20 entry, those positions cost $25,000 and $2,500 respectively. Both have $500 planned price risk before costs, but they use very different amounts of capital.
The position-sizing guide covers the formula. This article's distinction is that a risk budget and a capital-allocation limit solve different problems.
Apply the other limits too
The formula does not override available cash, maximum position value, liquidity or aggregate exposure.
Suppose a $10,000 position-value cap applies at a $20 entry. You can buy at most 500 shares under that cap. With the $0.40 stop distance, planned price risk is $200, below the $500 budget.
A risk budget is a ceiling, not a requirement to use the full amount. Do not add leverage or move the stop merely to force the calculator to reach it.
Round quantities appropriately and allow for charges. If fees are fixed, account for them before treating the remaining amount as available price risk.
A stop does not guarantee the loss
If the $20 share gaps to $18 while you hold 500 shares, the price change is a $1,000 loss relative to entry. A stop at $19.60 does not guarantee a $200 outcome.
FINRA's stop-order guidance explains why execution can differ from a stop price. A stop-limit order can also fail to execute.
Keep planned stop risk and adverse-gap scenarios as separate figures. The amount invested still matters: a large position with a tight stop can carry substantial gap exposure.
Compare risk across open positions
Add planned risk across the portfolio using consistent definitions and currencies. Then consider whether related positions could suffer together.
Three positions each risking $300 imply $900 total planned stop risk. They do not imply three independent risks or a guaranteed $900 maximum.
Use the portfolio-heat guide for the aggregation and its limitations.
Use the calculator as a check
Swingfolio's position-size calculator helps translate entry, stop and chosen risk into a share count. Compare its result with your cash and concentration limits before using it.
Record the initial plan. Changing the stop later should not erase the original risk used to review the trade's outcome.
Is a smaller dollar position always safer?
No. Volatility, stop distance, leverage and liquidity matter. For ordinary unleveraged shares, invested value still limits some exposures, but it does not describe every practical risk.
Should I tighten a stop to afford more shares?
Only if the revised stop is justified by a tested strategy rule. Changing it solely to force a larger quantity changes the trade.
General information only. Figures are hypothetical and exclude costs unless stated.