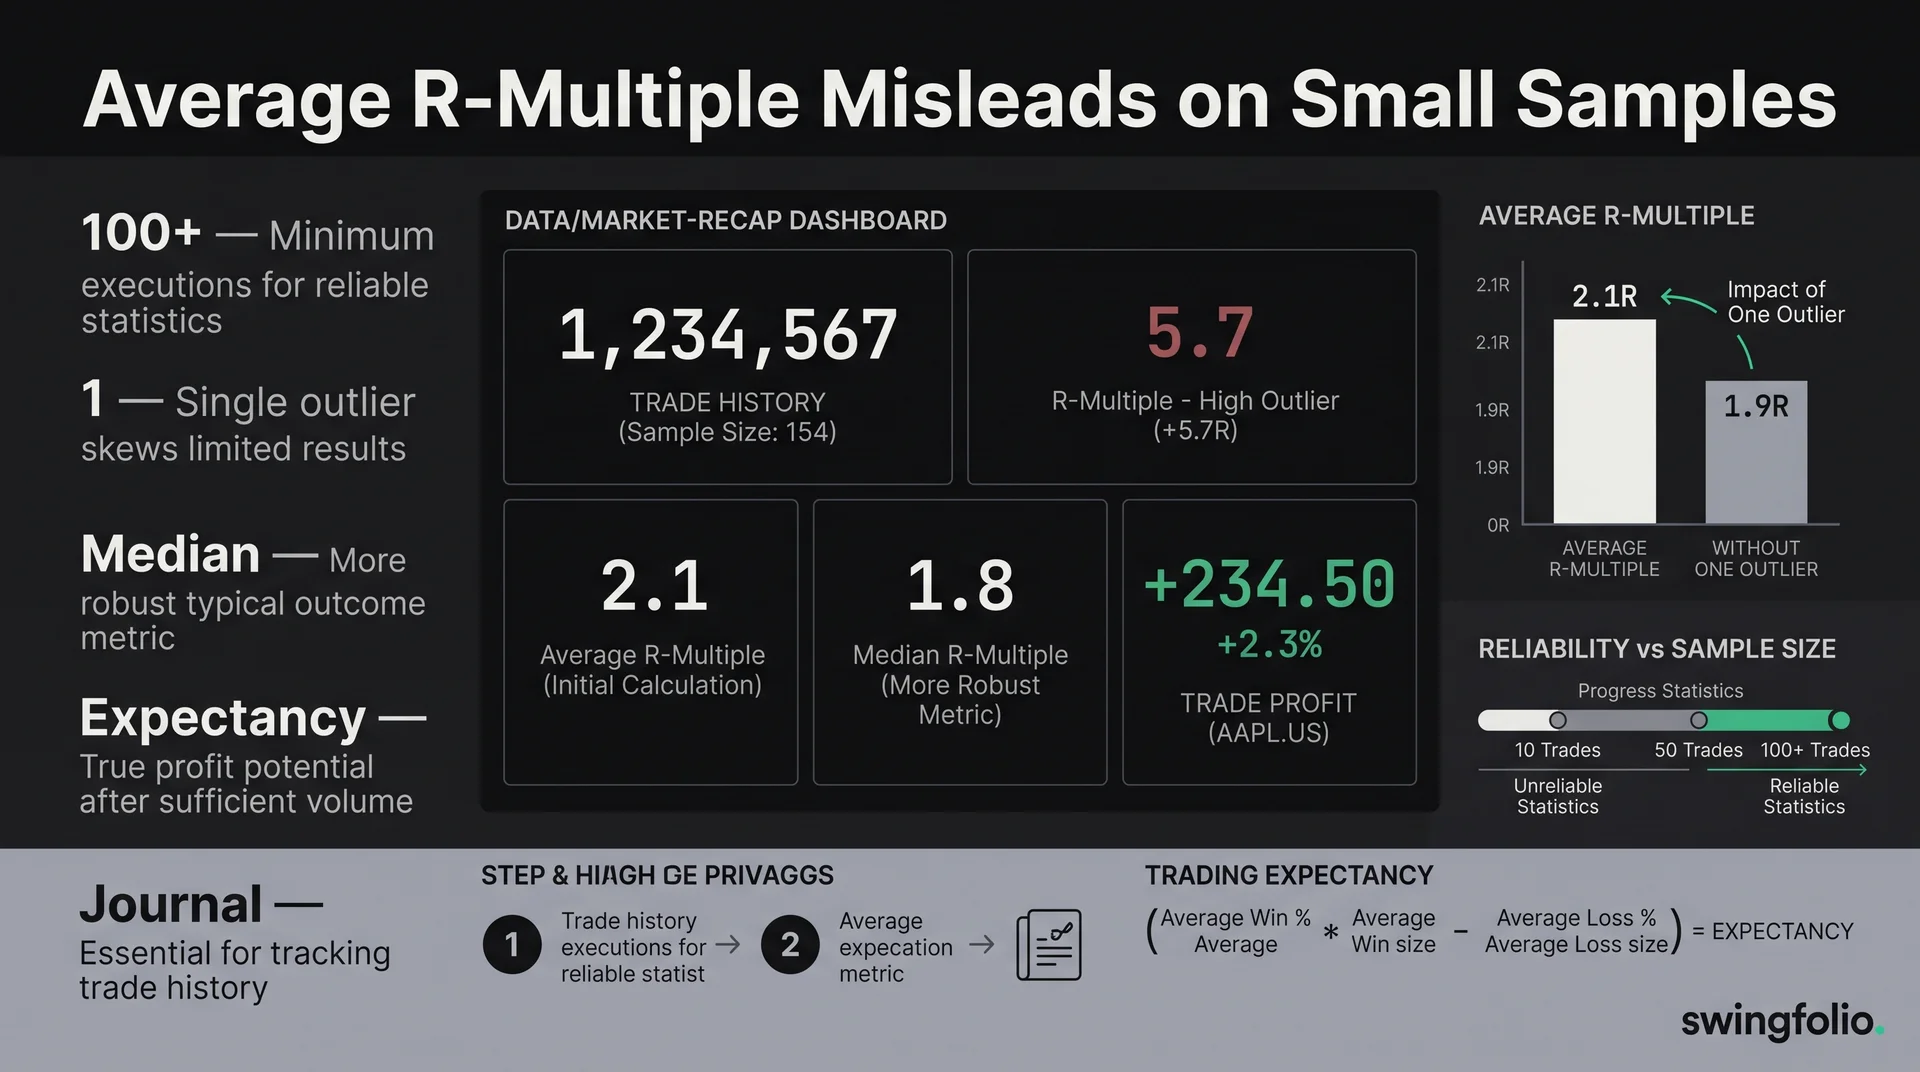
Eight of nine trades lose 0.5R. The ninth makes 12R. The record sums to 8R, so its raw average is +0.89R. Its median is -0.5R because the middle trade lost.
Both figures are correct. The mean says the complete nine-trade record made money in risk units. The median says the typical trade lost. Sample size decides how much confidence either answer deserves.
What is R-multiple in trading?
R-multiple expresses a trade result as a multiple of its initial planned risk. For the formula, long and short examples and free calculator, start with what an R-multiple is.
Average R formula
Average R is the arithmetic mean of those results. It is one estimate of expectancy in risk units:
Average R = sum of trade R-multiples / number of trades
Work the nine-trade example three ways
The results are:
-0.5, -0.5, -0.5, -0.5, -0.5, -0.5, -0.5, -0.5, +12
| Summary | Result | What it answers |
|---|---|---|
| Raw mean | +0.89R | What did the full sample average, including its largest winner? |
| Median | -0.50R | What did the middle trade produce? |
| Mean without the 12R winner | -0.50R | What would this record look like if that one tail event had not occurred? |
The third row is a sensitivity check, not permission to delete a real winner. Trend-following and breakout strategies can depend on rare large gains. A negative median does not disprove that edge. It tells you the edge is tail-dependent: most trades may lose while a few large winners pay for them.
The unanswered question is frequency. Nine trades cannot show whether a 12R result appears often enough to support the raw mean.
How sample size changes average R-multiple
There is no universal trade count that proves an edge. Required sample size depends on the spread and shape of results. A strategy with narrow outcomes settles faster than one built around rare 10R winners.
Use these questions instead of a magic threshold:
- How many independent opportunities does the setup produce?
- Does the sample include different market conditions?
- How much does the mean change when the best and worst trade are capped?
- Is one symbol, month or market regime responsible for the result?
- Did you apply the same entry, sizing and exit rules throughout the sample?
Swingfolio marks fewer than 20 computable trades as a low sample. That is a product warning and the point where its 5% winsorising has not begun. It is not a claim that trade 20 proves statistical significance.
Compare raw mean, median and winsorised mean
The raw mean keeps every result at full value. The median uses the middle result after sorting. A winsorised mean keeps every observation but caps each tail at selected boundary values.
In Swingfolio's R-multiple honesty view, samples of 20 or more use 5% winsorising at each end. With 20 trades, the lowest value is replaced by the second-lowest and the highest by the second-highest before the mean is calculated. The raw mean remains available when it differs enough to matter.
These summaries answer different questions:
- Raw mean measures the outcome you received, including tails.
- Median shows the centre of the trade distribution.
- Winsorised mean asks how the average looks when the most extreme values have less influence.
If all three are positive and close, the result is broad. If the raw mean is positive while median and winsorised mean are negative, the record depends heavily on tail winners. That may be the strategy's design, but you need more occurrences before estimating the tail reliably.
Treat no-stop trades as a different kind of R
A planned R denominator comes from entry and initial stop. Without a stop, planned reward-to-risk is undefined.
Swingfolio's headline honesty view can use maximum adverse excursion (MAE) as an implied denominator for a closed no-stop trade when price-history data is available. It divides the realised price move by the deepest adverse move. That is realised reward relative to worst experienced drawdown, not the risk you committed to before entry.
Keep that interpretation visible when comparing trades. A no-stop MAE result can help review what happened, but it does not turn an unplanned trade into a planned-risk observation.
The Swingfolio R calculation guide covers the exact long, short, partial-exit and no-stop paths.
Review average R without fooling yourself
- Filter to one setup with consistent rules.
- Record the number of trades with computable R.
- Read raw mean and median together.
- At 20 or more trades, compare the winsorised mean with the raw mean.
- Inspect the largest winner and loss without deleting either.
- Split the result by market regime or another condition you defined before review.
- Add new trades and check whether the estimates stabilise.
For a broader test of expectancy, consistency and evidence, continue with how to measure a trading edge. To check whether the same setup depends on market conditions, use the market regime journal guide.
Frequently asked questions
How many trades do I need before average R means anything?
There is no universal number. Fewer than 20 is a low sample in Swingfolio and receives no winsorising. Beyond that, confidence still depends on the variation, tail dependence and consistency of your trade process.
Why is my median R lower than my mean?
A few large winners are lifting the arithmetic mean above the middle trade. Check whether those winners are a repeatable part of the setup or one early outlier.
Can one big winner make a strategy look better than it is?
Yes, especially in a small sample. Keep the winner, then compare raw mean, median and a tail-capped sensitivity result.
What is a good average R-multiple?
No universal band fits every strategy. A positive average must still cover costs, survive new trades and match the strategy's expected distribution and frequency.
Should I delete outlier trades from my statistics?
No. Keep the record intact. Use median, winsorising and sensitivity checks to show how much influence an extreme result has.
Start the 30-day trial to compare raw, median and robust R summaries for your closed trades in Swingfolio.
General information only. Not financial advice.