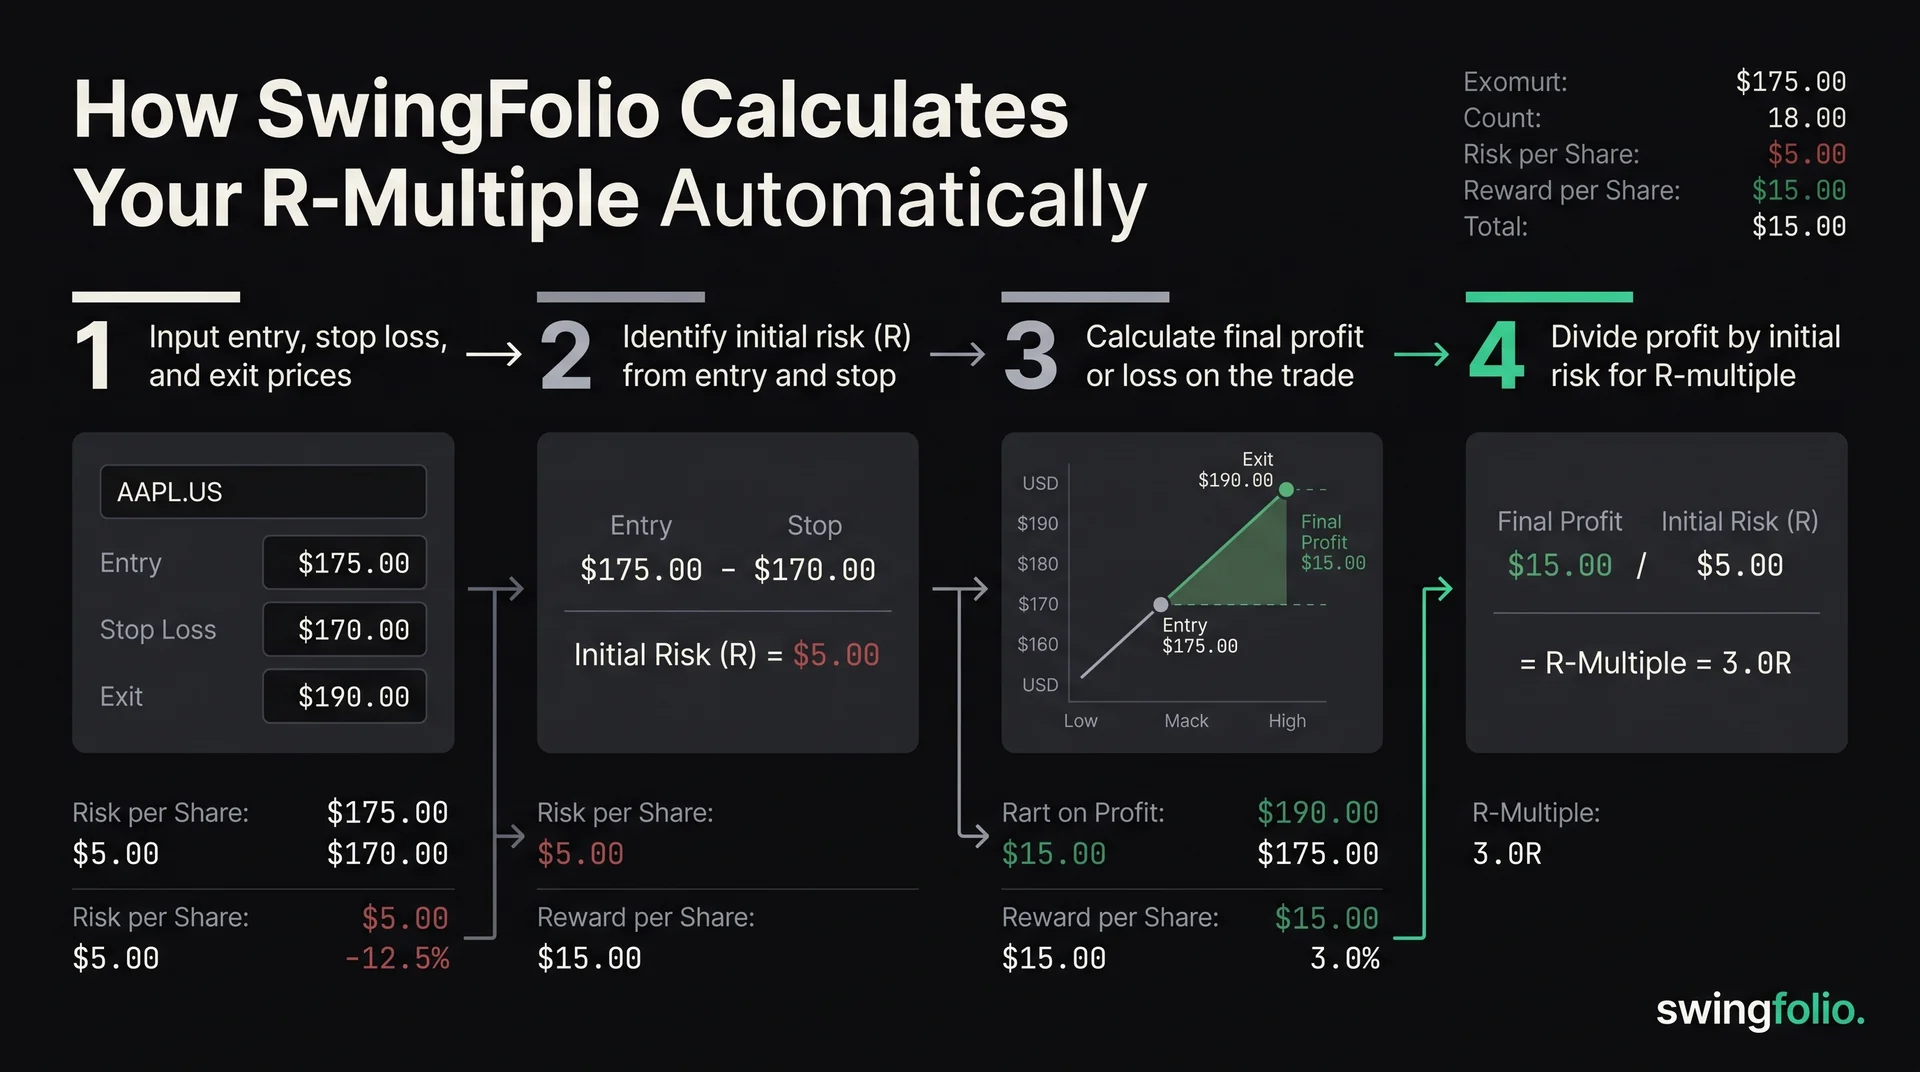
Swingfolio calculates a closed trade's R-multiple from its price result and initial planned risk. One R is the amount the price could move from entry to the original stop before the trade reached its planned loss.
The calculation normalises outcomes across different share prices and position sizes. A $500 profit can be +2.5R when initial risk was $200 or +0.5R when it was $1,000.
For the general formula and worked examples before seeing how Swingfolio applies them, start with what an R-multiple is.
The standard long and short formulas
For a long trade:
R-multiple = (exit price - entry price) / planned risk per unit
For a short trade:
R-multiple = (entry price - exit price) / planned risk per unit
Planned risk per unit comes from the frozen initial-risk amount divided by entry units when that value is available. Otherwise, a long uses entry minus stop and a short uses stop minus entry. A zero or negative risk distance does not produce an R value.
Long example
- Entry: $10.00
- Initial stop: $9.00
- Exit: $12.50
- Planned risk: $1.00 per share
- Price result: $2.50 per share
R = $2.50 / $1.00 = +2.5R
Short example
- Entry: $25.00
- Initial stop: $26.50
- Exit: $22.00
- Planned risk: $1.50 per share
- Price result: $3.00 per share
R = $3.00 / $1.50 = +2R
A long that exits at $22.80 after entering at $25 with a $23.50 stop records about -1.47R. That can reflect a gap through the stop, slippage or a later exit. The number identifies the result; the trade note should explain the cause.
Initial risk stays anchored when the stop moves
Swingfolio records the original planned risk when you create or import a trade with usable risk data. It uses that original amount when calculating R after you close or edit the trade.
Moving a stop later does not rewrite the denominator. This lets two exits from the same original plan remain comparable. A trail can reduce open risk, but it does not change what you accepted when you entered.
The standard stored calculation also requires a usable original stop. If a closed trade has no stop, its saved planned-risk R remains unavailable rather than inventing planned risk after the fact.
How partial exits become one R-multiple
Swingfolio keeps each partial exit leg, then calculates a units-weighted average exit price when the remaining position closes.
Suppose you buy 1,000 shares at $5.00 with an initial stop at $4.70:
- 500 shares exit at $5.60.
- 500 shares exit at $6.10.
- Weighted exit =
(500 x $5.60 + 500 x $6.10) / 1,000 = $5.85. - Planned risk =
$5.00 - $4.70 = $0.30per share. - R-multiple =
($5.85 - $5.00) / $0.30 = +2.83R.
The parent trade stores the aggregate result, while the trade detail keeps the exit legs visible. This gives you one comparable R value without hiding how the scale-out happened.
Fees and currency need separate interpretation
Swingfolio's standard R calculation is price-based. Entry and exit fees affect realised P&L, but they do not change the standard R numerator. Foreign-currency P&L is converted separately; the R formula compares price distances in the trade's listing currency.
That boundary is useful as long as you read both views. R tells you how the price outcome compared with planned price risk. Net P&L tells you what remained after recorded costs and currency conversion. A high-turnover setup can show positive price-based R while fees erase the cash edge.
What happens when a trade has no stop?
The saved planned-risk R is unavailable because planned risk is unknown. Two review surfaces can still calculate an MAE-based fallback when price-history excursion data is available: the R-multiple honesty view and the closed-trades table.
MAE means maximum adverse excursion, the deepest move against the trade while it was open. For a trade entered at $20 with a 5% MAE, implied risk is $1 per share. If the closed price result is $2 per share, the fallback is +2R.
That result answers “how much price profit did this trade make per unit of worst experienced drawdown?” It does not answer “how much did I plan to risk?” If excursion data is unavailable, Swingfolio leaves the fallback unavailable.
How the R-multiple honesty view summarises trades
The analytics view recomputes eligible closed trades through the stop-based or MAE fallback path. It then shows:
- raw mean R;
- median R;
- a low-sample warning below 20 trades;
- a 5% winsorised mean from 20 trades onward;
- best and worst R; and
- a middle-90% range once the sample supports it.
These summaries prevent one extreme trade from silently defining the headline. The average R and sample-size guide explains how to interpret their differences.
Other analytics based on saved planned-risk R can exclude no-stop trades. That is why an MAE-based result can appear in the honesty view while a strategy average uses a smaller set of trades.
Use R for review, not a verdict
R helps you compare a $20 stock with a $200 stock and a long with a short. It can also expose losses beyond the original stop and show whether partial exits improve or reduce the aggregate result.
Review the distribution with win rate, costs, sample size and market conditions. The free R-multiple calculator walkthrough covers manual planning, while this guide describes how Swingfolio stores and reviews completed trades.
Frequently asked questions
Does Swingfolio include fees in R-multiple?
No. Standard R is price result divided by initial planned price risk. Recorded fees affect realised P&L and should be reviewed beside R.
Does moving my stop change 1R?
No. The denominator stays anchored to the initial planned risk so later stop management does not rewrite the entry decision.
How are partial exits handled?
Swingfolio uses a units-weighted average exit across all exit legs, then compares that aggregate exit with entry and initial risk.
Can a trade without a stop receive an R value?
Its stored planned-risk R remains unavailable. The honesty view and closed-trades table can show an MAE-based review fallback when excursion data exists.
Start the 30-day trial to record an initial stop, close a trade and review its R calculation in Swingfolio.
General information only. Not financial advice.