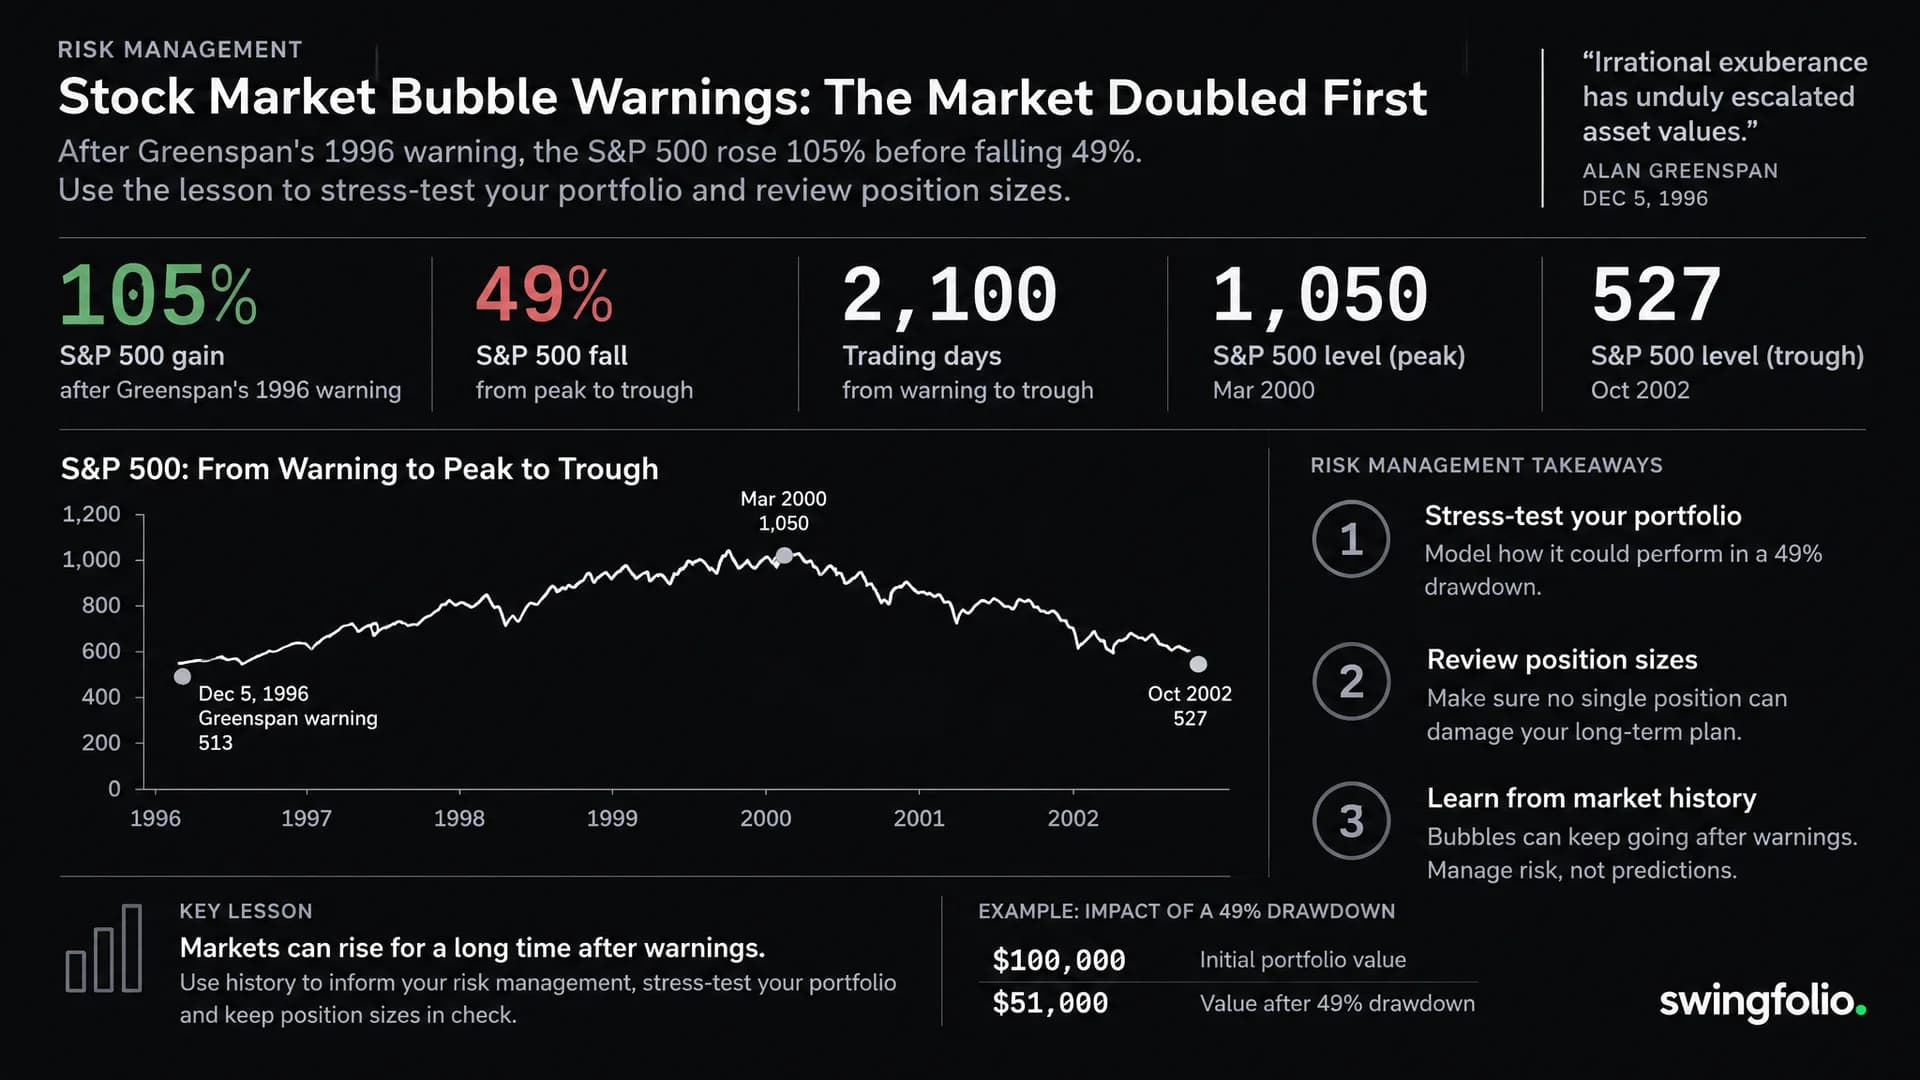
A stock market bubble warning can identify a real risk without telling you when prices will fall. After Alan Greenspan's 1996 “irrational exuberance” speech, the S&P 500 more than doubled before the dot-com bear market cut it almost in half.
For a swing trader, the useful question is what a severe fall would cost your portfolio. You can calculate that without knowing whether the next bubble headline is right.
What happened after Greenspan's irrational exuberance speech?
On 5 December 1996, Federal Reserve Chairman Alan Greenspan questioned whether investor enthusiasm had pushed asset prices too far. His original speech, published by the Federal Reserve, discussed the difficulty of recognising inflated asset values and their consequences for the economy.
It was a question about risk, not a dated forecast of a stock market crash.
Here is what the S&P 500, a broad index of large US companies, did next:
| Date | Event | S&P 500 close |
|---|---|---|
| 5 December 1996 | Day of Greenspan's evening speech | 744.38 |
| 24 March 2000 | Closing peak before the dot-com bear market | 1,527.46 |
| 9 October 2002 | Bear-market closing low | 776.76 |
The speech-day level is recorded in Barry Ritholtz's historical comparison. The peak and trough appear in Yardeni Research's historical bull and bear market tables, which cite Standard & Poor's data.
From the December 1996 close, the index gained about 105% before peaking more than three years later. It then fell about 49% over roughly two and a half years. At the October 2002 low, it remained about 4% above its speech-day level.
These are price-index comparisons. They exclude dividends, inflation, taxes, trading costs and any interest an investor might have earned in cash. The 1996 close also came before the evening speech, so it is a reference point, not an assumed trade execution price.
The striking part is the sequence: a warning, years of further gains, then a deep decline. Recognising danger and timing an exit are different problems.
Why a bubble warning is not a sell signal
A stock market bubble describes prices that appear difficult to justify through underlying business value, often supported by expectations of further price rises. That assessment does not supply an expiry date.
Two common reactions to a warning are to sell everything immediately or dismiss it because earlier warnings were premature. Neither response starts with the size of your own exposure.
The 1996 example does not prove that staying invested always wins. Someone buying near the 2000 peak faced a very different experience from someone holding since 1996. An index's eventual recovery also says little about an individual company that never recovers.
For swing traders, a bubble headline can prompt a review of position sizes, related holdings and exit rules. It is not a substitute for the entry and exit conditions in a trading plan.
Turn a stock market bubble warning into a portfolio stress test
A portfolio stress test asks what would happen under an assumed fall. It does not predict that fall or assign it a probability.
Suppose your portfolio is worth $50,000, with $30,000 in the shares or theme described by the headline. The remaining $20,000 is outside that group.
Start with two calculations:
Scenario loss = exposed holdings × assumed decline
Portfolio loss percentage = scenario loss ÷ total portfolio value × 100
All amounts below use the same currency. The example assumes ordinary, unleveraged share holdings.
| Assumed fall in the $30,000 group | Loss from that group | Loss as a share of the $50,000 portfolio |
|---|---|---|
| 20% | $6,000 | 12% |
| 35% | $10,500 | 21% |
| 50% | $15,000 | 30% |
Each row assumes the other $20,000 stays unchanged. That is a simplifying assumption, not protection: if those other holdings also fall 15%, they add another $3,000 loss. Combined with the 50% scenario, the portfolio would lose $18,000, or 36%.
The historical S&P 500 decline makes a roughly 50% fall a useful severe scenario to examine. It does not mean the next bubble will fall 50%, or that individual shares cannot lose more.
Before doing the maths, check whether your exposure is larger than it looks. A direct shareholding, a technology ETF and a broad index fund may all hold the same company. Our guide to portfolio concentration and overlapping holdings explains how to identify those connections.
Compare the scenario with your maximum drawdown
Maximum drawdown is the largest fall from a previous peak to a later low in a recorded value series. A fall from $50,000 to $45,000 is a $5,000, or 10%, drawdown.
Suppose that was the largest portfolio decline you have experienced. The $15,000 stress-test loss above is three times that dollar amount. It represents 30% of today's $50,000 portfolio.
That gap is worth examining before prices move. A past 10% drawdown is evidence about your recorded history; it is not a forecast, a safe limit or proof that you could comfortably hold through a 30% loss.
Compare like with like:
- Use percentages when comparing portfolios of different sizes.
- Check that the historical record covers the period you actually held the investments.
- Account for deposits and withdrawals when interpreting changes in portfolio value.
- Remember that the scenario starts from today's value, while drawdown is measured from a peak. If you are already below that peak, a further loss deepens the drawdown.
Recovery also takes a larger percentage gain than the loss. A $50,000 portfolio that falls 30% to $35,000 needs a 42.9% gain to return to $50,000, before costs or cash flows.
Use the drawdown calculator to explore recovery maths, or read the maximum drawdown calculation guide for a worked example.
What can you change without predicting a crash?
The part you can control is how much you expose and the rules you follow.
If a scenario would create a loss you cannot afford, review the amount invested in that company or theme. Consider your need for cash, your existing allocation limits and the effect of several positions falling together.
For an individual swing trade, position sizing starts with the amount you plan to risk and the distance between entry and stop. A portfolio stress test answers a broader question: what happens if related holdings fall together, including gaps through planned exits?
A stop order does not guarantee the exit price. Keep a severe scenario separate from the smaller loss you hope an orderly exit would deliver.
Write down four things during the review:
- The holdings exposed to the same risk.
- The assumed declines and their dollar effects.
- The portfolio or trade rules that would require action.
- The date or event that will trigger the next review.
That gives the next headline something concrete to test.
Review your drawdown in Swingfolio
In Swingfolio, open the relevant portfolio and look for the Drawdown card. It shows maximum and current drawdown from the portfolio history available in the app.
Place that history beside your scenario calculation. Check both the percentage loss and its dollar value, and make sure the currencies and starting values match.
The card provides historical context. Your stress test asks what could happen to today's holdings. Used together, they help turn an unsettling headline into a specific portfolio review.
Frequently asked questions
How long after Greenspan's warning did the market peak?
The S&P 500 reached its dot-com-era closing peak on 24 March 2000, more than three years after the 5 December 1996 speech. Over that interval, the price index rose about 105%.
Should you sell shares when someone calls the market a bubble?
The label alone cannot determine that decision. Review your exposure, cash needs and trading rules, then calculate what several possible declines would cost. A warning can justify a risk review without providing a reliable exit date.
Does a 50% fall in a sector mean a 50% portfolio loss?
Only if the whole portfolio has that exposure and falls by the same amount. If 60% of an unleveraged portfolio falls 50% while everything else stays unchanged, the portfolio loses 30%. Losses elsewhere would increase the total.
Can past maximum drawdown predict your next loss?
No. It describes the deepest decline in the recorded history. Different holdings, larger positions or a more severe market move can produce a larger future loss.
General information only. Not financial advice. Historical outcomes and hypothetical scenarios do not predict future returns.