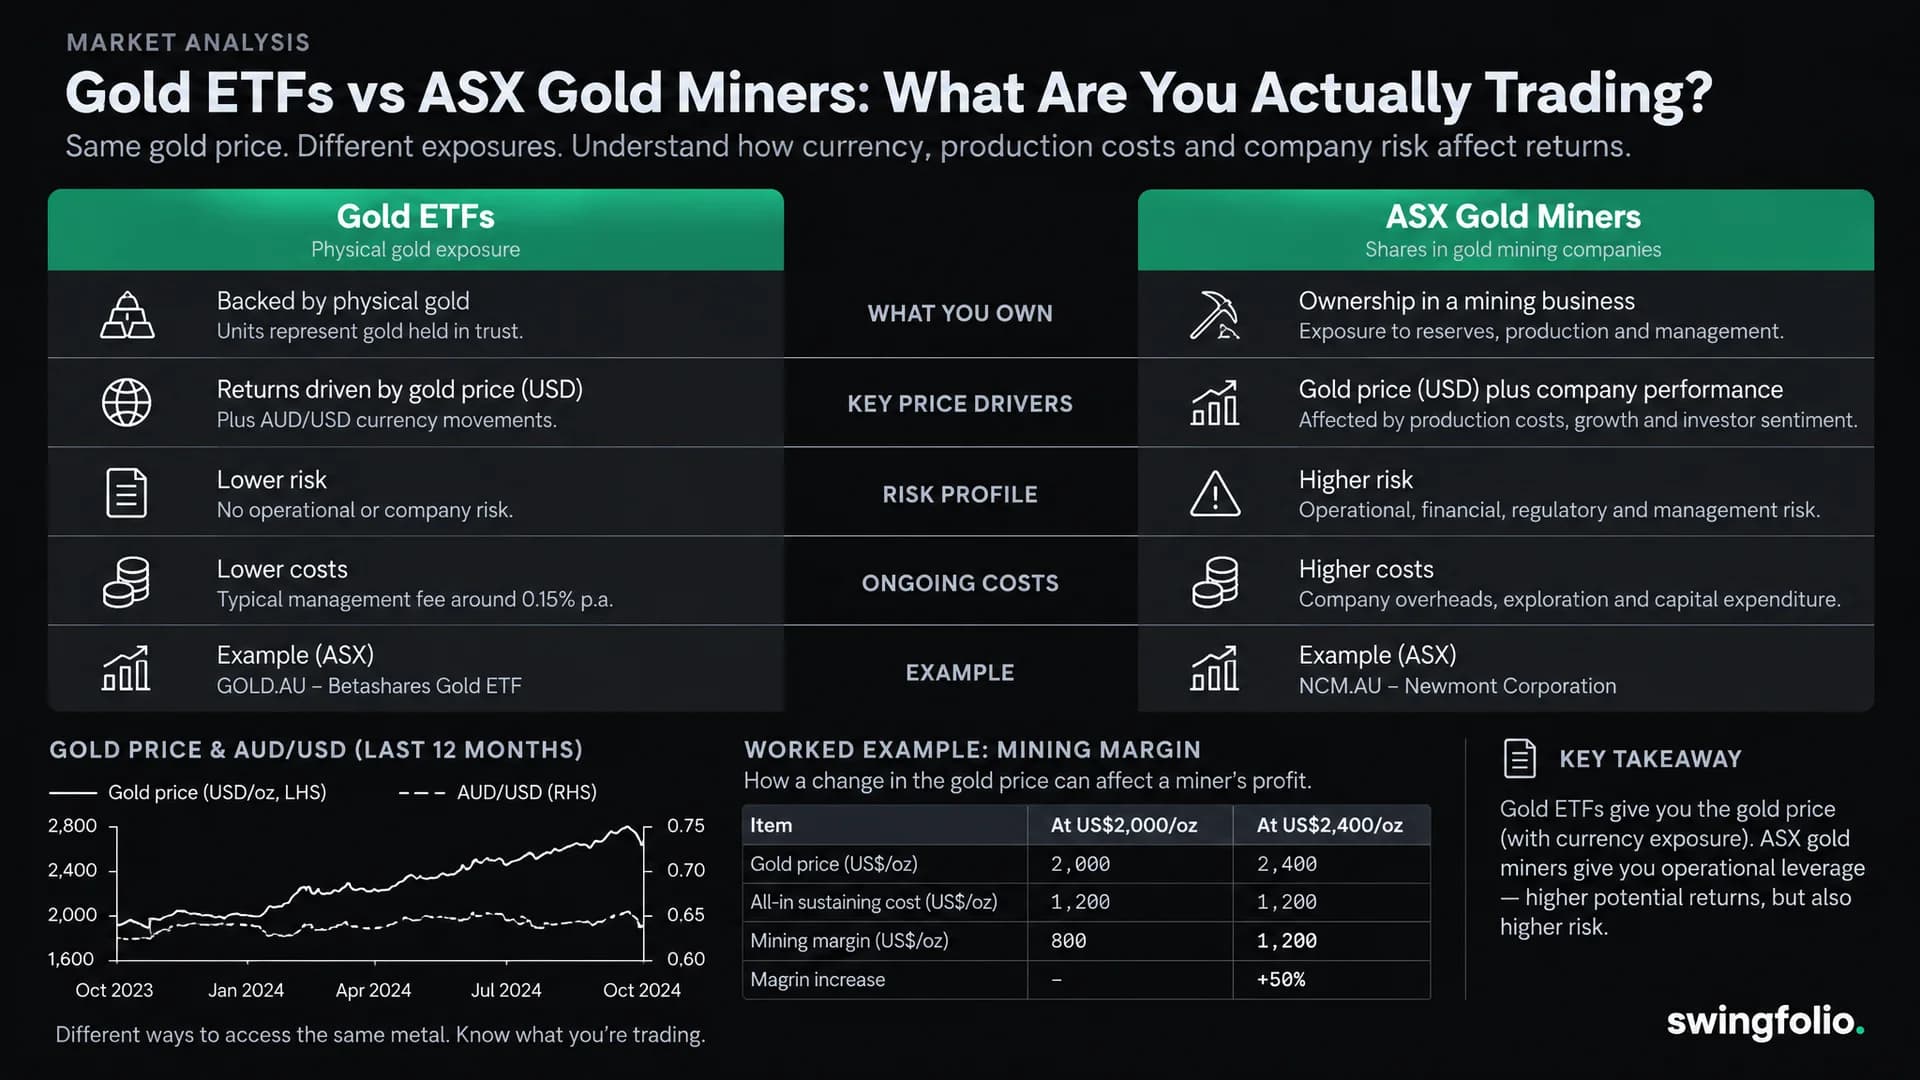
A physical gold ETF gives you exposure to bullion through a fund or security structure. An ASX gold miner gives you equity exposure to a business that produces or hopes to produce gold. The two can respond differently to the same gold-price move.
That distinction matters after a large inflow into the metal. The World Gold Council's August 2026 ETF report, published on 9 September, recorded US$18 billion of monthly inflows and holdings of 4,189 tonnes. Those figures describe demand for gold-backed products, not the profitability of an individual mine.
Start with the asset inside the investment
| Exposure | What you are assessing | Main extra checks |
|---|---|---|
| Physically backed gold product | Bullion price exposure and product structure | Fees, custody, currency treatment and redemption terms |
| Individual producing miner | A business selling gold and managing costs | Production, costs, debt, hedging and management |
| Gold-miner ETF | A portfolio of mining companies | Holdings, country exposure, concentration and fees |
| Explorer or developer | A project that may become a mine | Funding, permits, resource assumptions and construction |
A gold-miner ETF spreads company exposure across holdings, but it remains an equity investment in miners. It does not become physically backed bullion because its name contains “gold.”
Global X's comparison of physical commodity and miner ETFs is a useful product-provider starting point. For an actual purchase, read the specific product disclosure statement rather than transferring one fund's terms to another.
Why mining profits can move faster than gold
Consider a simplified producing mine. Assume it sells 100,000 ounces, receives A$4,000 per ounce and incurs A$3,000 per ounce in the operating costs included in this example.
| Scenario | Gold received per ounce | Modelled cost per ounce | Margin per ounce | Total modelled margin |
|---|---|---|---|---|
| Starting case | $4,000 | $3,000 | $1,000 | $100 million |
| Gold price rises 10%; costs unchanged | $4,400 | $3,000 | $1,400 | $140 million |
| Gold price rises 10%; costs rise 10% | $4,400 | $3,300 | $1,100 | $110 million |
| Gold price falls 10%; costs unchanged | $3,600 | $3,000 | $600 | $60 million |
With fixed output and costs, a 10% rise in the sale price produces a 40% increase in this margin. A 10% price fall cuts the margin by 40%.
This is operating sensitivity, not a forecast for the share price. The model excludes tax, finance costs, capital spending and other cash requirements. It is not net profit or a company's published all-in sustaining cost calculation.
Production can also change. Selling fewer ounces, treating lower-grade ore or spending more on development can outweigh a better gold price.
Read the miner's own disclosures
Before treating a miner as a gold-price trade, examine:
- Production guidance: ounces expected, timing and recent revisions.
- Cost definitions: what the reported measure includes and excludes.
- Hedge commitments: prices and volumes already contracted.
- Balance sheet: available cash, debt and major spending commitments.
- Operating concentration: dependence on one mine, country or permit.
- Other metals: revenue exposure beyond gold.
A rising spot price does not tell you the realised price on every ounce. Nor does it resolve a funding shortfall.
The ASX sector comparison helps place a miner within a watchlist, but your entry rationale should use that company's current evidence.
Currency changes the comparison
Gold commonly trades against the US dollar, while an Australian investor measures wealth in AUD. An unhedged bullion product can therefore move because of both gold and the exchange rate.
A miner may receive US-dollar-linked revenue while paying some costs in AUD and other currencies. Hedging arrangements can change the result again. Do not use the bullion fund's currency sensitivity as a precise estimate for the miner.
Check the fund's stated currency policy. An ASX listing and an AUD unit price do not, by themselves, mean the underlying exposure is currency hedged.
Compare the same dates and return definitions
A fair comparison needs the same start and end dates, reporting currency and treatment of income. Include fund costs, brokerage and any dividends when relevant.
Keep three questions separate:
- Which exposure matched the view you wanted to express?
- Which investment produced the better total return over the chosen period?
- Which trade followed your recorded entry and exit rules?
You can answer the second question after the event without having known the winner beforehand. Use the benchmark comparison guide to avoid mixing USD spot performance with an AUD account result.
Build a record that explains the choice
For a bullion trade, record the product, hedge policy, entry price and reason for the exposure. For a miner, add the company-specific production or cost assumption that could invalidate the idea.
If you hold several miners, inspect shared mine locations and operating risks as well as ticker count. A portfolio of five gold companies still has a common commodity driver. The portfolio concentration guide offers a framework for reviewing combined exposure.
In your Swingfolio notes, keep the original reason for choosing the metal or the business. That makes a later review more useful than recording “gold went up.”
Common questions
Do gold miners always rise when gold rises?
No. Production, costs, financing and expectations can dominate a commodity move. An explorer may have no operating gold revenue at all.
Is a gold-miner ETF equivalent to a physical gold ETF?
No. Check its holdings and mandate. A basket of mining equities carries business risks that a bullion-backed exposure does not share in the same way.
Does a recent inflow prove gold is a good entry now?
No. Flows describe past allocations. Your purchase price, holding period and risk limits still require a separate decision.
Reviewed 27 September 2026. Figures in the margin example are hypothetical. General information only.