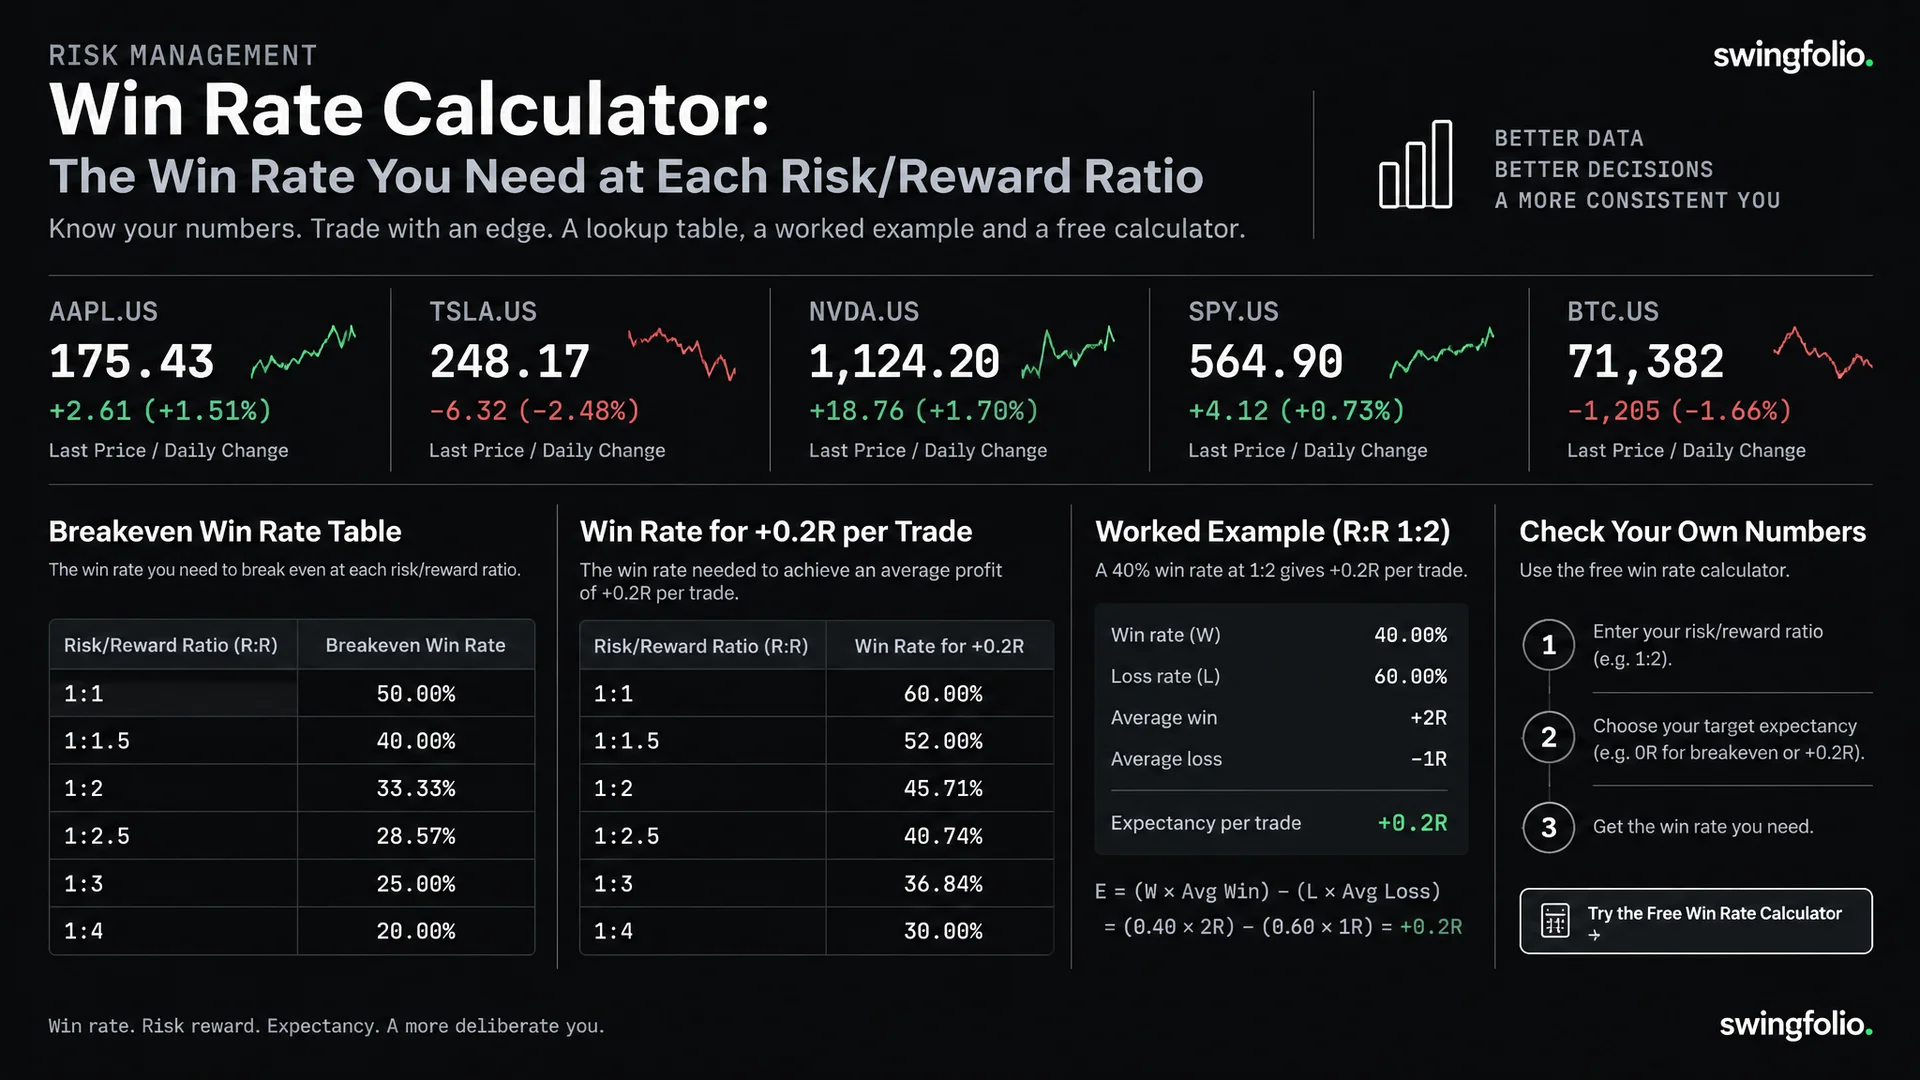
The win rate you need to break even at a risk/reward ratio of 1:A is 1 divided by (1 plus A). At 1:2 you need about 33.3% winners; at 1:3 you need 25%. The free win rate and risk/reward calculator runs the same arithmetic on the inputs you select.
Every figure below is arithmetic on hypothetical inputs. It excludes trading costs unless a section says otherwise, and it assumes no trade finishes flat: every trade is either a win or a loss.
How to work out the win rate you need
The breakeven win rate is the share of trades that must win for total gains to equal total losses. Measure results in R, where 1R is the amount you planned to risk on the trade. Let A be the average win in R and L the average loss in R. Then:
Breakeven win rate = L / (A + L)
When every loss is 1R, L = 1 and the formula becomes 1 / (1 + A). A 1:2 risk/reward ratio means you risk 1 unit to make 2, so A = 2 and the breakeven win rate is 1 / 3, about 33.3%.
You can check it with three trades. One winner at +2R and two losers at -1R each total 0R.
When your average loss is not 1R, use the general form. An average win of 1.8R and an average loss of 1.2R gives 1.2 / 3.0 = 40%.
Win rate needed at each risk/reward ratio
The table assumes every loss is 1R. The +0.2R column uses W = (1 + 0.2) / (1 + A), which comes from the expectancy formula in the next section. The last column counts whole trades: the fewest winners in 10 trades for a total of 0R or better.
| Risk/reward ratio | Breakeven win rate | Win rate for +0.2R per trade | Fewest winners in 10 trades for a result of 0R or better |
|---|---|---|---|
| 1:1 | 50.0% | 60.0% | 5 |
| 1:1.5 | 40.0% | 48.0% | 4 |
| 1:2 | 33.3% | 40.0% | 4 |
| 1:3 | 25.0% | 30.0% | 3 |
| 1:4 | 20.0% | 24.0% | 2 |
| 1:5 | 16.7% | 20.0% | 2 |
Percentages for 1:2 and 1:5 are rounded to one decimal place.
The last column shows where whole trades and percentages give different answers. At 1:2, three winners in 10 total -1R (3 x 2R minus 7 x 1R), so you need a fourth winner. At 1:4, two winners in 10 total exactly 0R (2 x 4R minus 8 x 1R).
The gap between the two win rate columns narrows as the ratio widens: 10 percentage points at 1:1, about 3.3 points at 1:5. Each percentage point of win rate is worth (1 + A) hundredths of 1R per trade: 0.02R at 1:1 and 0.06R at 1:5. At a wide ratio, the same change in win rate moves expectancy further, up or down.
How do you calculate expectancy in R?
Expectancy is the average result per trade, measured in units of initial risk. The formula is:
Expectancy = (win rate x average win in R) - (loss rate x average loss in R)
Two examples at a 1:2 ratio with 1R losses:
- At a 40% win rate: (0.40 x 2) - (0.60 x 1) = 0.80 - 0.60 = +0.2R per trade
- At a 30% win rate: (0.30 x 2) - (0.70 x 1) = 0.60 - 0.70 = -0.1R per trade
A result in R converts to dollars only through the dollar amount you risked. If every trade risks the same dollar amount, a total of 0R is also $0 before costs. If your risk varies from trade to trade, the dollar total can differ from the R total.
For a fuller treatment of what R measures, see R-multiples explained.
How to use the win rate calculator
The risk/reward calculator takes five inputs:
- Win Rate: the share of closed trades that won.
- Average Win (R-Multiple): the average winning trade, in units of initial risk.
- Average Loss (R-Multiple): the average losing trade, in units of initial risk. It is 1R when every loss exits at its planned stop.
- Trades Per Month: how many trades close in a month.
- Risk Per Trade (%): the share of the account risked on each trade.
It returns expectancy per trade in R and as a percentage of the account, a monthly figure, the breakeven win rate and profit factor. The monthly figure multiplies expectancy per trade by trades per month. It is a calculation on your inputs, not a forecast.
The tool opens at a 45% win rate, a 2R average win, a 1R average loss, 8 trades a month and 1% risk. Those inputs return:
- Expectancy: (0.45 x 2) - (0.55 x 1) = +0.35R per trade, or +0.35% of the account
- Monthly: 8 x 0.35R = +2.8R
- Breakeven win rate: 1 / 3, shown as 33.3%
- Profit factor: 0.90 / 0.55, about 1.64
The inputs are sliders with set ranges: win rate from 10% to 90% in whole points, average win from 0.5R to 5R, and average loss from 0.5R to 2R. Three limits apply when you enter your own figures.
- Every trade that is not a win counts as a loss. The calculator has no input for flat trades. If your record has trades that closed at 0R, the loss rate it uses is higher than yours.
- The profitability matrix assumes a 1R average loss. Below the results, the matrix shows win rates from 25% to 70% against average wins from 0.5R to 5R, with cells coloured by whether expectancy is positive or negative. If your average loss is 1.2R, the main result uses 1.2R and the matrix does not. At a 45% win rate and a 2R average win, the main result is +0.24R while the matrix cell reads +0.35R. The highlighted cell is also the nearest displayed win rate and average win, so a 42% win rate is highlighted in the 40% row even when the average loss is 1R.
- Planned targets are not averages. If your winning trades return 1.5R on average and your losses are 1R, breakeven is 40%, whatever the target on each trade said. The calculator works on the averages you enter.
To size a single trade from its entry and stop, use the position size calculator. It takes the entry price, the stop loss, your account value and the percentage you want to risk.
How do fees and slippage change the breakeven win rate?
Suppose every trade pays the same cost of k in R, average wins are A in R before costs, average losses are 1R before costs, and no trade is flat. The breakeven win rate becomes (1 + k) / (1 + A).
At 1:2, a cost of 0.10R per trade lifts breakeven from about 33.3% to 1.10 / 3, about 36.7%.
The full method, including how to convert brokerage, spread and slippage into R for your own stop distances and order sizes, is in breakeven win rate after trading costs.
How many trades before your win rate means anything?
In a small sample, one trade moves the win rate a long way. Within a fixed sample of 10 trades, changing one result from a loss to a win moves the win rate from 40% to 50%. Within 100 trades, the same change moves it from 40% to 41%.
In general, changing one loss to a win moves the win rate by 100 / N percentage points, where N is the number of trades. Average R-multiple and sample size works through how the answer changes as the trade count grows.
Where to go next
- For how a risk/reward ratio is set from entry, stop and target, read understanding risk/reward ratios and calculate risk/reward before every entry.
- If you win often but your account is flat, high win rate but losing money walks through the payoff check.
- To compare win rate with total gains and losses, see win rate vs profit factor.
Frequently asked questions
What win rate do I need with a 1:2 risk/reward ratio?
About 33.3% to break even before costs, and 40% for +0.2R per trade. Both assume an average loss of 1R, an average win of 2R and no flat trades. In a sample of 10 trades, that means 4 winners for a result of 0R or better.
Does exactly 33.3% break even at 1:2?
Not quite. The exact breakeven is one third. At 33.3%, (0.333 x 2R) - (0.667 x 1R) = -0.001R per trade. The rounded figure in the table sits a fraction below the line.
Is a 35% win rate profitable?
It depends on the payoff. In R, a 35% win rate gives +0.05R per trade at a realised 1:2 payoff and -0.125R per trade at 1:1.5, before costs.
Does a higher risk/reward ratio lower the win rate I need?
Yes. The breakeven win rate falls from 50% at 1:1 to about 16.7% at 1:5. Whether expectancy improves depends on what happens to your own win rate at the wider ratio, and the calculator shows the result for the combination you select.
Is risk/reward written 1:2 or 2:1?
This page and the calculator write risk first, so 1:2 means you risk 1 unit to make 2.
Try your own numbers: open the free win rate and risk/reward calculator, enter the win rate and average win and loss from your closed trades, and read your breakeven win rate against the table above.
All figures are hypothetical arithmetic and exclude trading costs unless stated. General information only. Not financial advice.